- AUDNZD 1H CHART
Market news
3 October 2017
AUDNZD 1H CHART
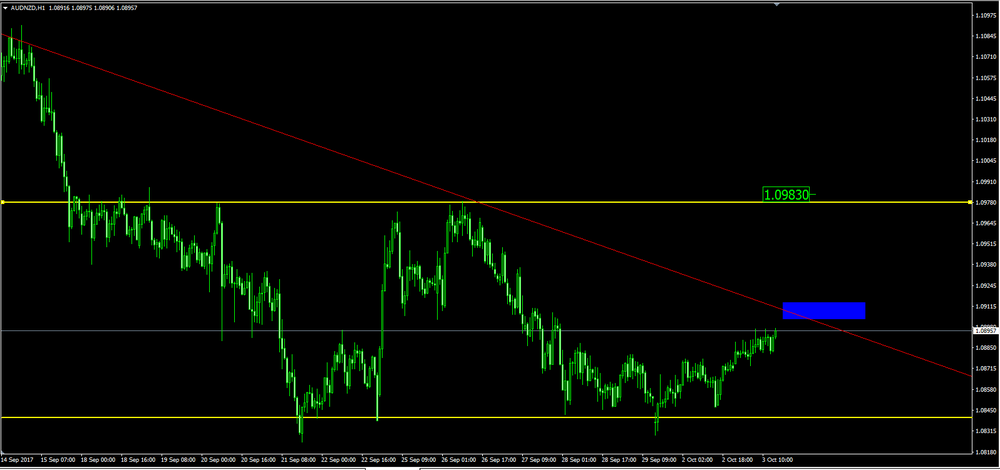
As we can see on 1-hour time frame chart, the price is moving toward our downside trend line.
If the price breaks that trend line we might see a new bullish movement close to 1.09830.
Our suggestion is to wait until price gets close to our blue rectangle which is our entry point, and see how it reacts there.
Market Focus
Open Demo Account & Personal Page