- AUD/CAD 1H TIME FRAME CHART
Market news
19 October 2017
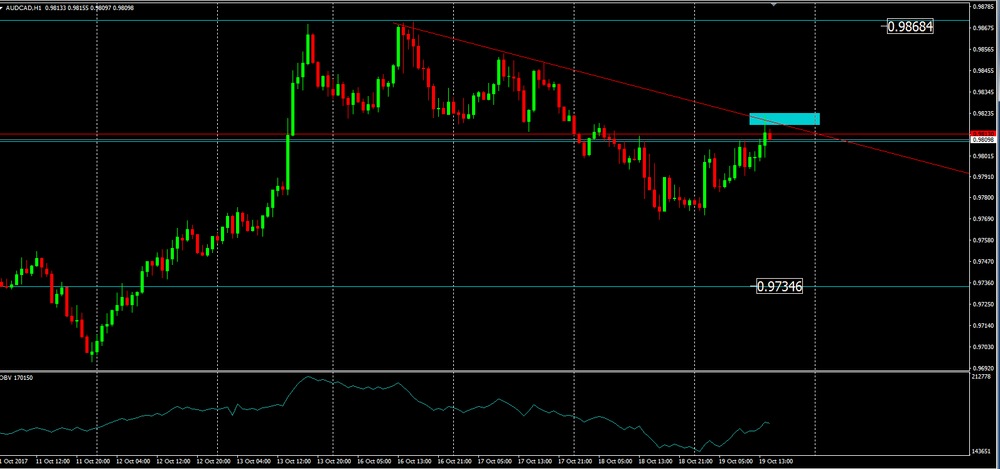
AUD/CAD 1H TIME FRAME CHART
As we can see on 1 hour time frame chart, the price is about to hit our downside trend line.
In this way, we can be attentive to two scenarios. If the price breaks our trend line and if as the next h1 candles close above the same line, then we can expect a bullish move to values close to 0.9868 by stopping slightly below the trend line.
Other scenario, if the price shows signs of downward rejection of this same line then it may indicate a possible new downward impulse thus forming a lower low relative to the previous one.
Market Focus
Open Demo Account & Personal Page