- GBP/CHF DAILY TIME FRAME CHART
Market news
23 October 2017
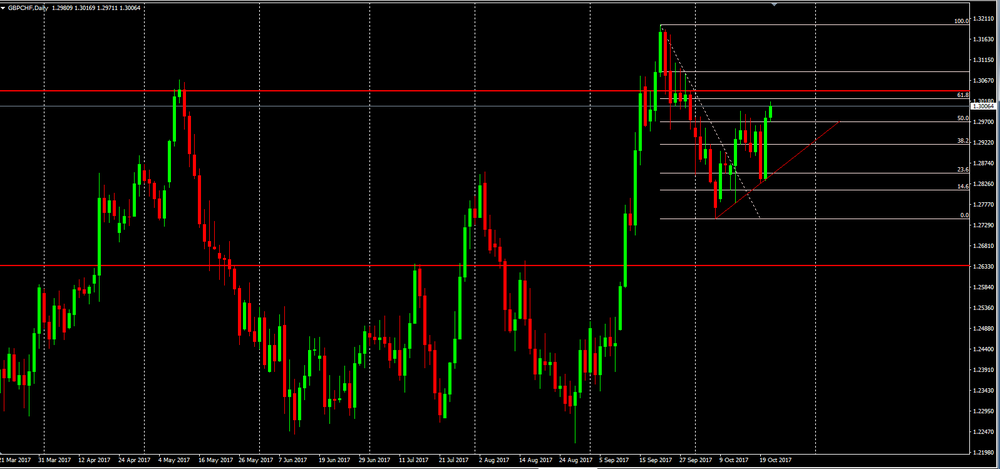
GBP/CHF DAILY TIME FRAME CHART
As we can seen on the daily chart, GBP/CHF reached new highs and since that it has been correcting his last bullish movement.
In this case, the use of fibonacci levels is useful to see if the price is showing signs of recovering its previous bullish tendency, or if in the case of rejecting the 61.8% fibonacci, a reversal of bearish.
Therefore, in this asset we have two possible bias.
Our suggestion is to wait for the closing of today's candle (Monday) and then draw conclusions for either long or short entries.
Market Focus
Open Demo Account & Personal Page