- CAD/CHF DAILY CHART
Market news
25 October 2017
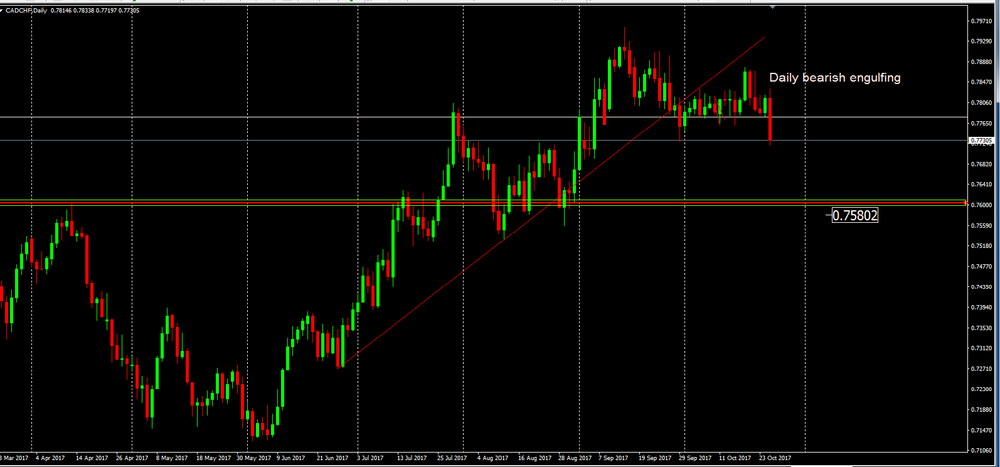
CAD/CHF DAILY CHART
As we can see no chart daily , the trend line that has been respected for several days has recently been broken.
However, and after the breakout or price ended by entering into consolidation.
If the daily candle close like this or similar, then we might have the confirmation of a pattern of candles ("Bearish Engulfing") in which it will give some indications of beginning of a new bearish tendency.
in a bearish scenario we might see the price going down until close to 0.7580.
Market Focus
Open Demo Account & Personal Page