- GBP/USD 1H Time Frame Chart
Market news
8 November 2017
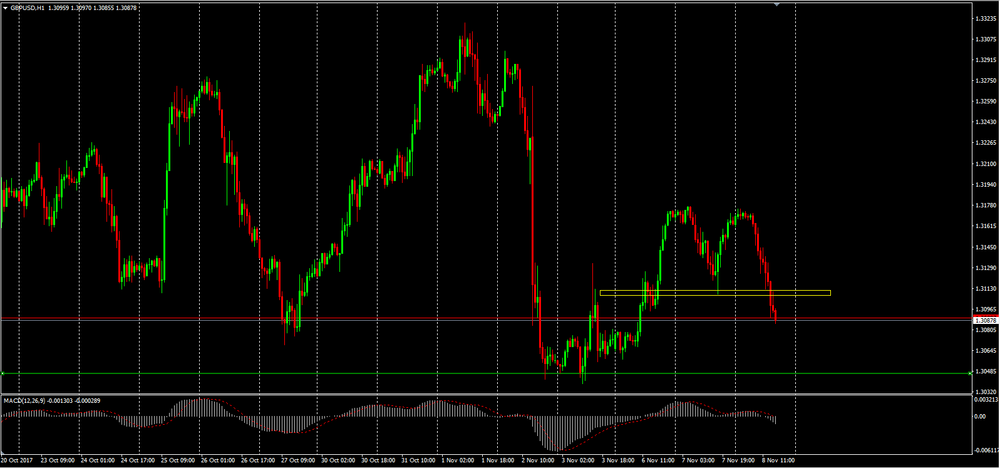
GBP/USD 1H Time Frame Chart
As we can see on 1h time frame chart, it is possible to see a chart pattern "Double Top" which the neckline has already been broken.
Therefore, it might be possible to see a depreciation of the British pound agaisnt the U.S dollar to values close to 1.305
Market Focus
Open Demo Account & Personal Page