- Nikkei 225 - 4h time frame chart
Market news
22 November 2017
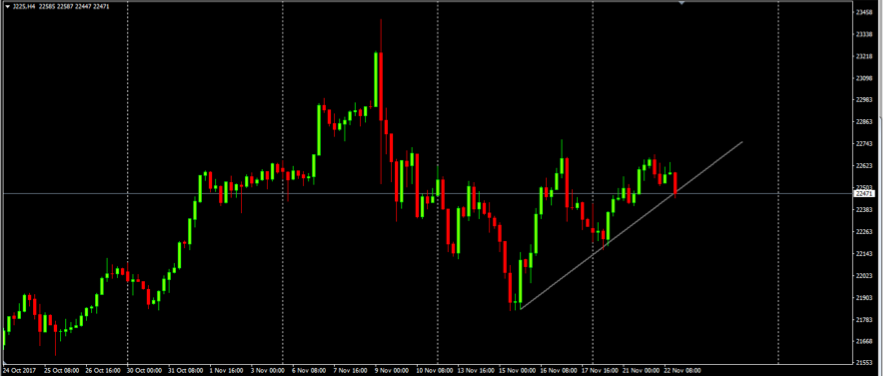
Nikkei 225 - 4h time frame chart
On 4-hour time frame chart we can see that price is now close to the upside trend line.
In this scenario, we can consider long or short entries.
However, it depends of the price how it behaves in this area.
So, we might consider a bullish movement if the price rejects the trend line (wicks touching the trend line)
Besides that, if the price breaks the trend line, then we can expect a depreciation of the Nikkei 225 to the previous relative minimums.
Market Focus
Open Demo Account & Personal Page