- Nikkei 225 - 4h time frame chart
Market news
23 November 2017
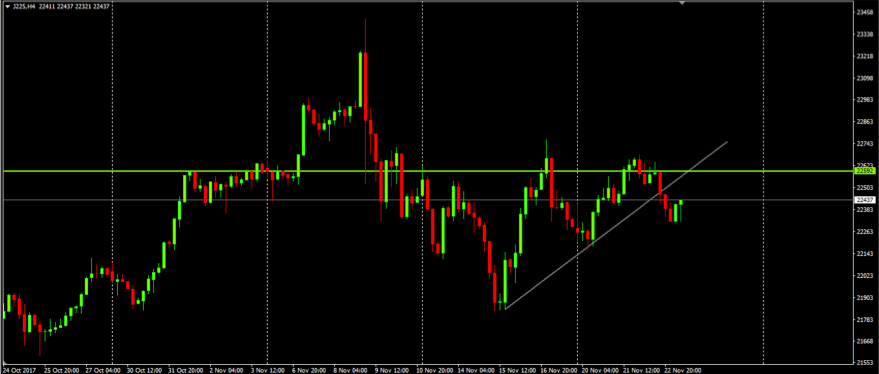
Nikkei 225 - 4h time frame chart
On 4-hour time frame chart we can see that price has broken the upside trend line and at this moment we can see that the price might retest the trend line to start a bearish movement.
In this scenario, if the price retests again the trend line and if it rejects that then we might consider a new bearish movement soon.
However, if the price retests above the trend line then we can conclude that there was a fake breakout and we can expect a continuation of a bullish movement.
Market Focus
Open Demo Account & Personal Page