- AUD/JPY Daily time frame chart
Market news
4 December 2017
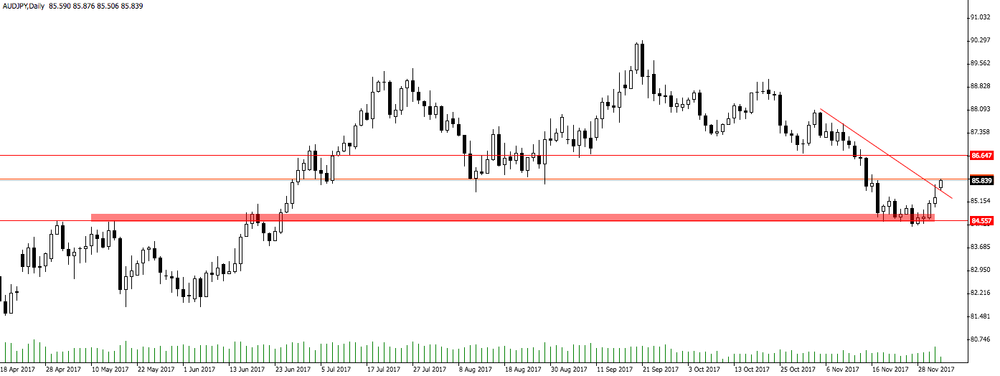
AUD/JPY Daily time frame chart
As we can see, if the daily candle closes above the downside trend line, we might expect a further appreciation on AUD/JPY.
Otherwise, if the price doesn't hold above the downside trend line, then we can consider go short when the price breaks the support level (red rectangle).
Market Focus
Open Demo Account & Personal Page