- GBP/USD Daily time frame chart
Market news
5 December 2017
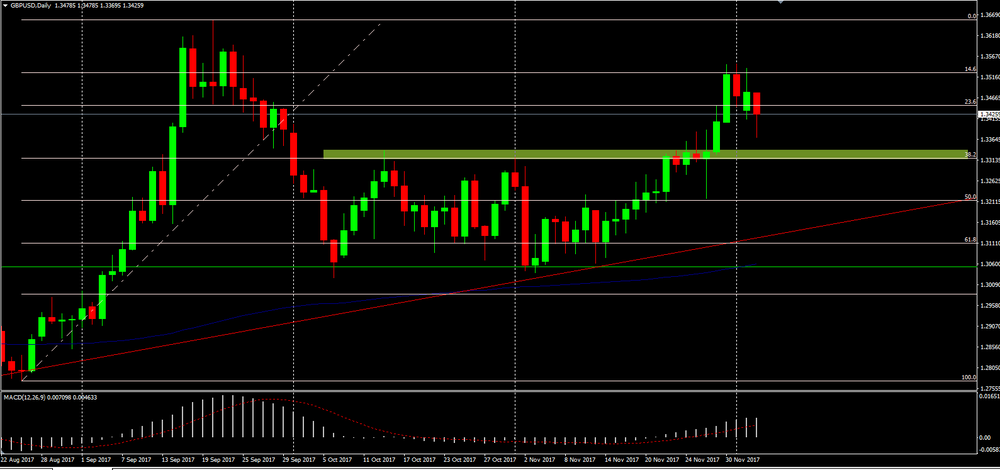
GBP/USD Daily time frame chart
On Daily time frame chart we can see that GBP/USD has broken the consolidation zone.
Therefore, the price may make a slight correction and if it tests the support level then we might see a further appreciation on GBP/USD.
Market Focus
Open Demo Account & Personal Page