- Crude Oil (WTI) 4-hour time frame chart
Market news
6 December 2017
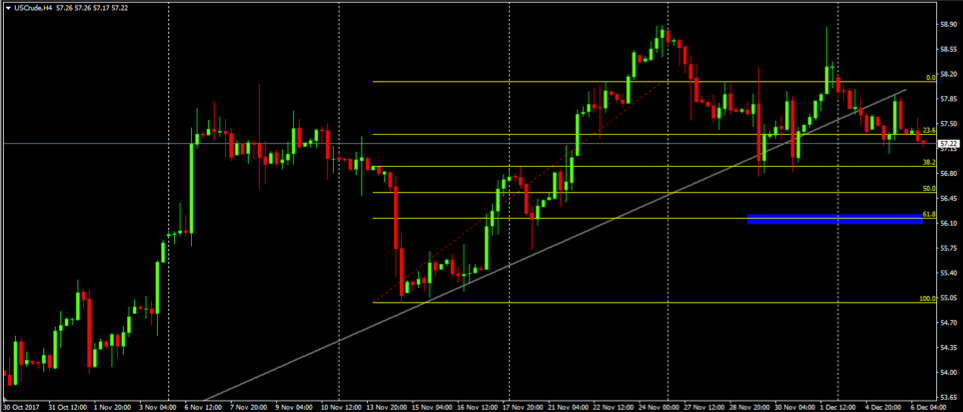
Crude Oil (WTI) 4-hour time frame chart
On 4-hour time frame chart we can see that the price has broken the upside trend line and it has tested below the trend and after that test, the price started a new bearish movement.
If the bearish movement confirms, then we might expect a further depreciation on Crude Oil close to 61.8 fibonnaci levels (blue rectangle)
Market Focus
Open Demo Account & Personal Page