- AUD/JPY 4-hour time frame chart
Market news
11 December 2017
AUD/JPY 4-hour time frame chart
AUD/JPY 4-hour time frame chart
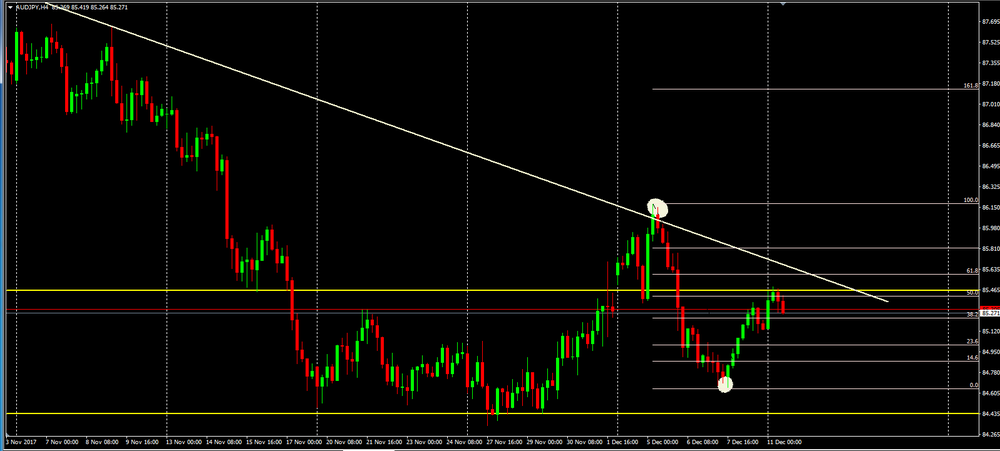
As we can see on 4-hour time frame chart, the price has been falling and respecting a downside trend line.
However, the price has been correcting its last bearish movement and now it seems that there is a potential new bearish movement soon.
We can see that the price is rejecting the resistance level and the fibonacci's levels, therefore, we can expect a further downside movement, at least to the previous low.
Market Focus
Open Demo Account & Personal Page