- AUD/JPY Daily time frame chart
Market news
18 December 2017
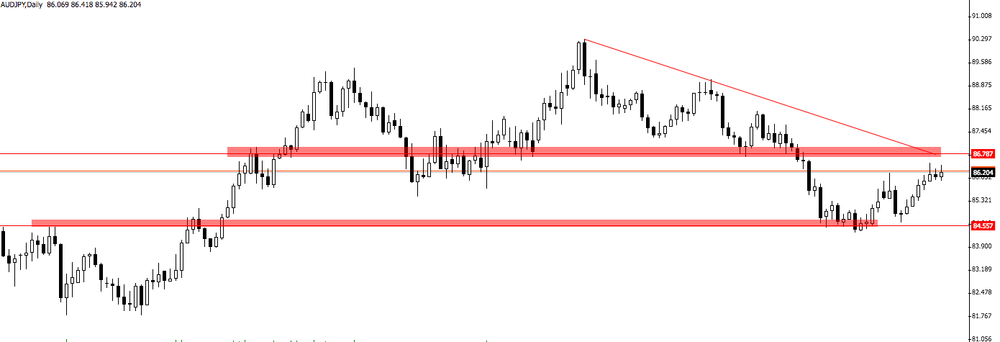
AUD/JPY Daily time frame chart
AUD/JPY on daily time frame chart is giving signs of recovery its last bearish movement.
However, it can be interesting to see how the price reacts close to the downside trend line and the resistance level.
Therefore, if the price rejects the breakout of these levels then we can expect a new bearish movement
Market Focus
Open Demo Account & Personal Page