- NZD/JPY Daily time frame chart
Market news
18 December 2017
NZD/JPY Daily time frame chart
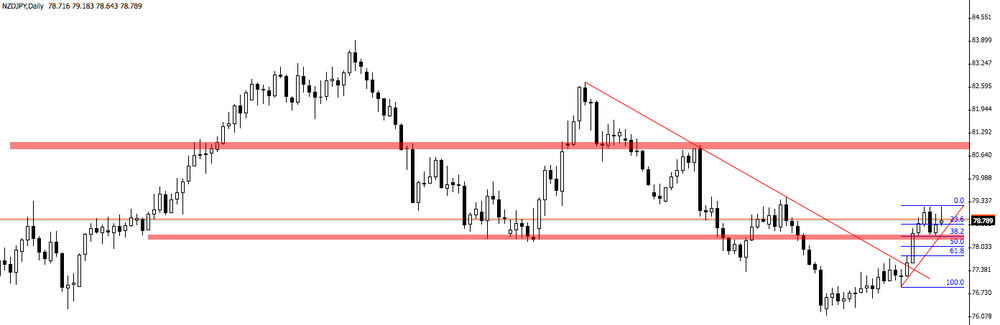
NZD/JPY is showing a slowdown of its last bullish movement.
On daily time frame chart, we can see that the price has broken the downside trend.
However, it didn't test the trend line so the price could go back close to that trend line again.
In this scenario, we can expect a slight correction of the price in order to start a new bullish movement.
Market Focus
Open Demo Account & Personal Page