- Nikkei 225 - 4h time frame chart
Market news
19 December 2017
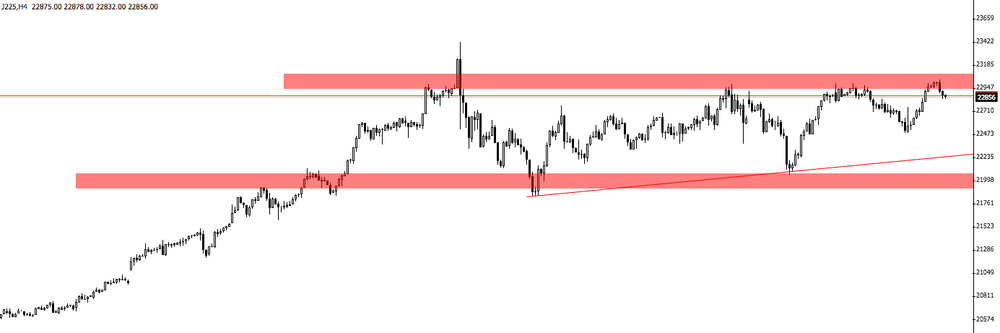
Nikkei 225 - 4h time frame chart
On 4-hour time frame chart we can see that the price is stuck in a consolidation zone.
However, we can see that the price is forming a upside trend line which can be interesting to see.
Market Focus
Open Demo Account & Personal Page