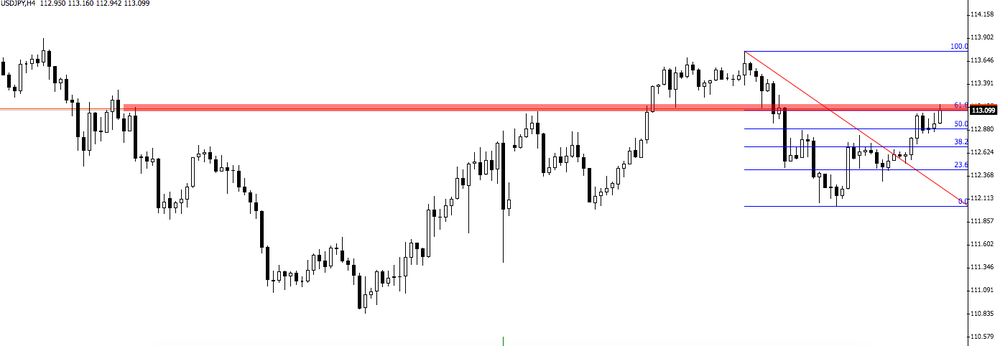
- USD/JPY 4 hour time frame chart
Market news
20 December 2017
USD/JPY 4 hour time frame chart
On 4-hour time frame chart, it is possible to see that the price is now in an interesting zone which might give us an opportunity to go short.
If the price remains rejecting the fibonacci's level and the resistance level then we can expect a new bearish movement in this pair.
Market Focus
Open Demo Account & Personal Page