- DAX Daily Time Frame Chart
Market news
3 January 2018
DAX Daily Time Frame Chart
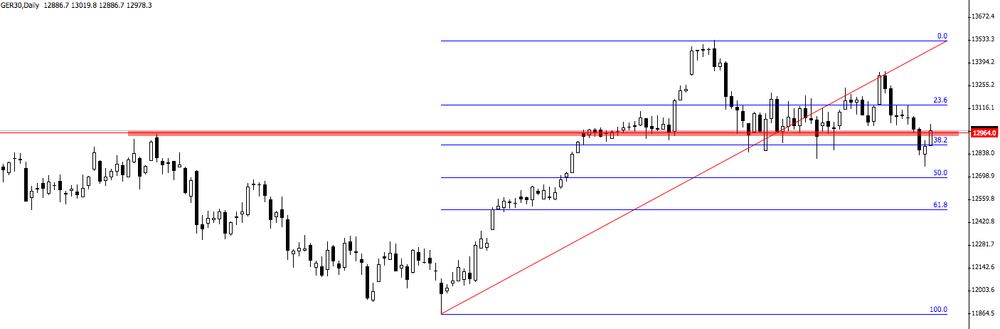
As we can see on daily time frame chart, the price has been correcting its movement after it reach new highs.
However, we can see that the price is rejecting for several times the Fibonacci levels 38.2% which can be interesting.
Therefore, we can expect a further bullish movement in this pair.
Market Focus
Open Demo Account & Personal Page