- BTC/USD Daily time frame chart Analysis
Market news
11 January 2018
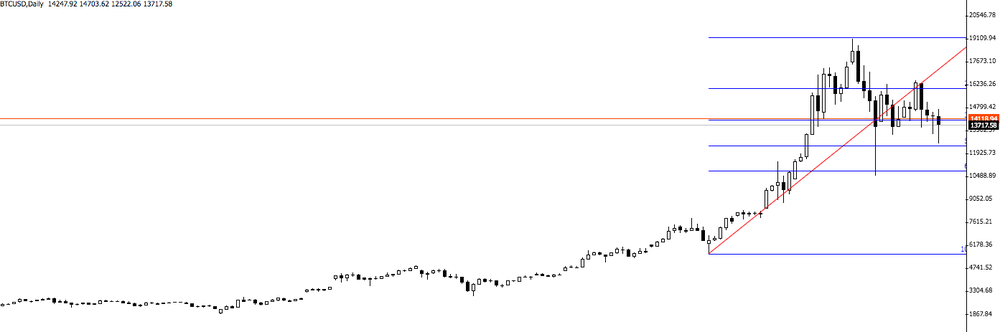
BTC/USD Daily time frame chart Analysis
On daily time frame chart, we can see that the price has been falling for several days.
However, the price has been respecting pretty well the Fibonacci levels (50% and 61.8%).
The price is now moving close to these levels which can be a good opportunity to long entries.
Market Focus
Open Demo Account & Personal Page