- Nikkei 225 Daily time frame chart
Market news
12 January 2018
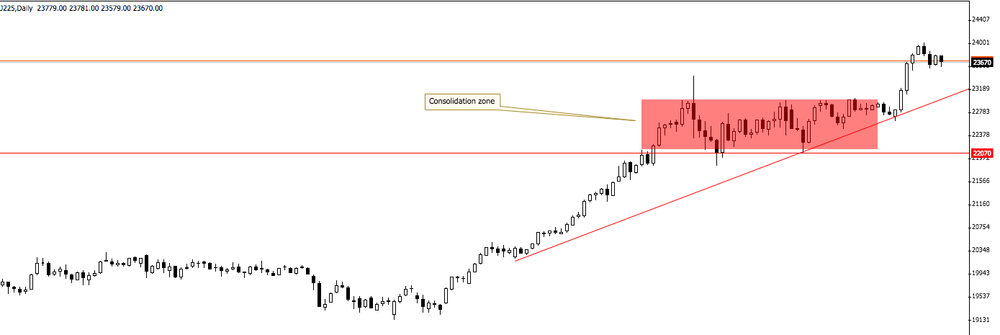
Nikkei 225 Daily time frame chart
Nikkei 225 is reaching new highs!
If we look on daily time frame chart we can see that the price has already broken a consolidation zone.
Also, we can see that the price is forming an upside trend line.
Therefore, our bias is long if the price remains above the trend line.
Market Focus
Open Demo Account & Personal Page