- BTC/USD Analysis
Market news
27 February 2018
BTC/USD Analysis
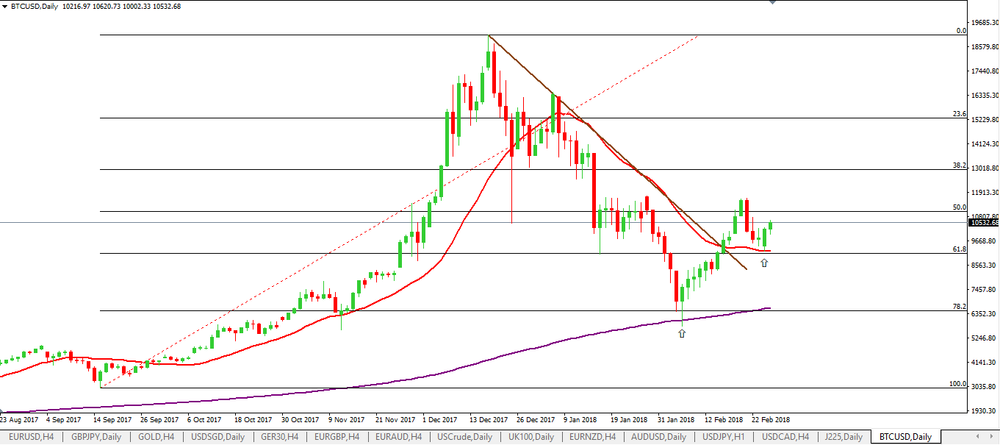
On daily time frame chart, we can see that Bitcoin is giving again signs of a possible new bullish trend after the last bearish month.
We can see on the chart that the price has rejected the fibonacci's levels 78.2% and the Moving Average (SMA 200).
Besides that, we also can see that the price has broken the downside trend line.
Therefore, we can expect a further bullish movement on BTC/USD.
Market Focus
Open Demo Account & Personal Page