- Oil Cancels Immediate Bullish Trend and Tests 100-day Average
Market news
Oil Cancels Immediate Bullish Trend and Tests 100-day Average
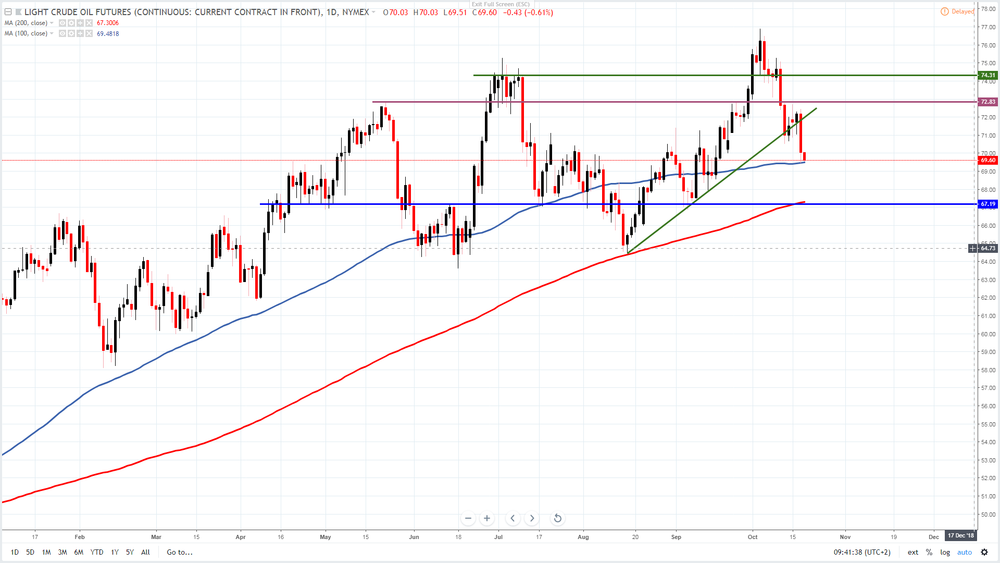
Oil continues to decline, and it is now down by 10 per cent from its October highs, effectively entering correction territory. It was trading at 0.7 per cent lower on Thursday and was seen near 69.60 USD, where the 100-day moving average stands.
This is the main support for today's trading and if it is removed, the bearish trend could be confirmed with the next target at 67.20 USD, where the 200-day moving average converged with previous lows.
Oil has also broken below the short-term bullish trend line, which confirmed the bearish bias for the near term.
The resistance is located at 71.00 USD today and if the price jumps above this level, we could see a retest of the broken trend line at 72.00 USD. However, if the price breaks below the mentioned 100-day average, stop losses could be hit, which may quickly send oil lower.
Disclaimer:
Analysis and opinions provided herein are intended solely for informational and educational purposes and don't represent a recommendation or an investment advice by TeleTrade. Indiscriminate reliance on illustrative or informational materials may lead to losses