- Oil continues to test resistance MA 200 H1
Market news
Oil continues to test resistance MA 200 H1
Brent crude traded lower on Friday and closed the day in the red around $39.45. Today oil is slightly higher, rising to $40.40. On the hourly chart, Brent continues to test the strength of the resistance - the moving average line MA (200) H1 ($39.35). On the four-hour chart, oil remains below the MA 200 H4 line. Based on the foregoing, it is probably worth sticking to the south direction in trading and while Brent remains below MA 200 H1, it may be necessary to look for a sell entry point at the end of the correction.
Resistances levels are at: $41.25-45, $42.70, $43.20
Support levels are at: $39.05, $38.25, $36.95
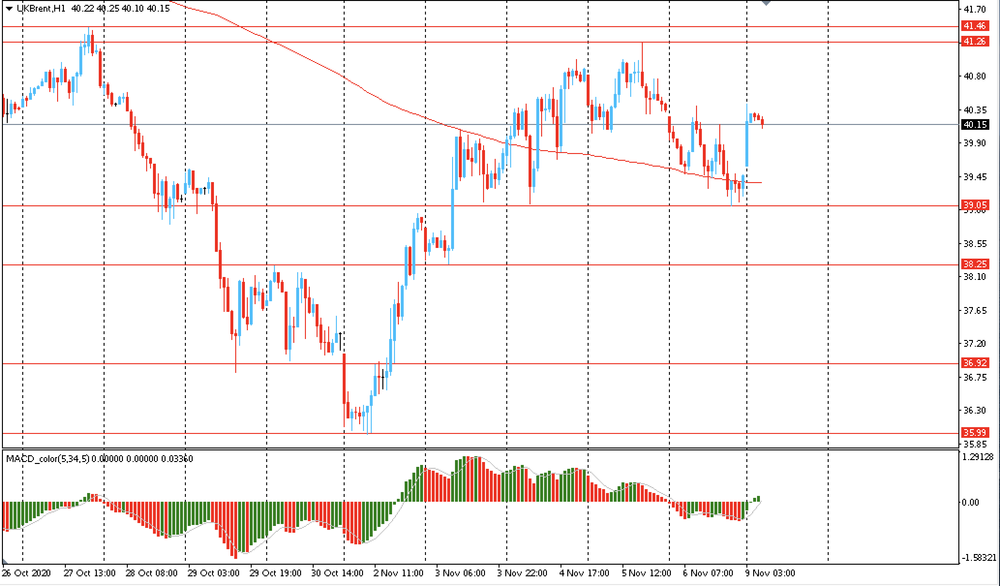
Probably, the main scenario - is a subsequent decline to $39.05 (Nov 6 low). An alternative scenario - may be final consolidation above the MA 200 H1 with a subsequent rise to $42.70 (Oct 23 high).