- NZD/USD Price Analysis: Countertrend traders to eye 0.7050
Market news
NZD/USD Price Analysis: Countertrend traders to eye 0.7050
- NZD/USD runs into weekly and daily resistance, eye son the downside.
- 0.7050 is a confluence level of support to target.
The NZD/USD price has extended beyond the weekly resistance line as it was illustrated as a possibility in the analysis from Monday's North American session, NZD/USD Price Analysis: Meeting resistance and W-formation is bearish:
NZD/USD weekly chart, before & after
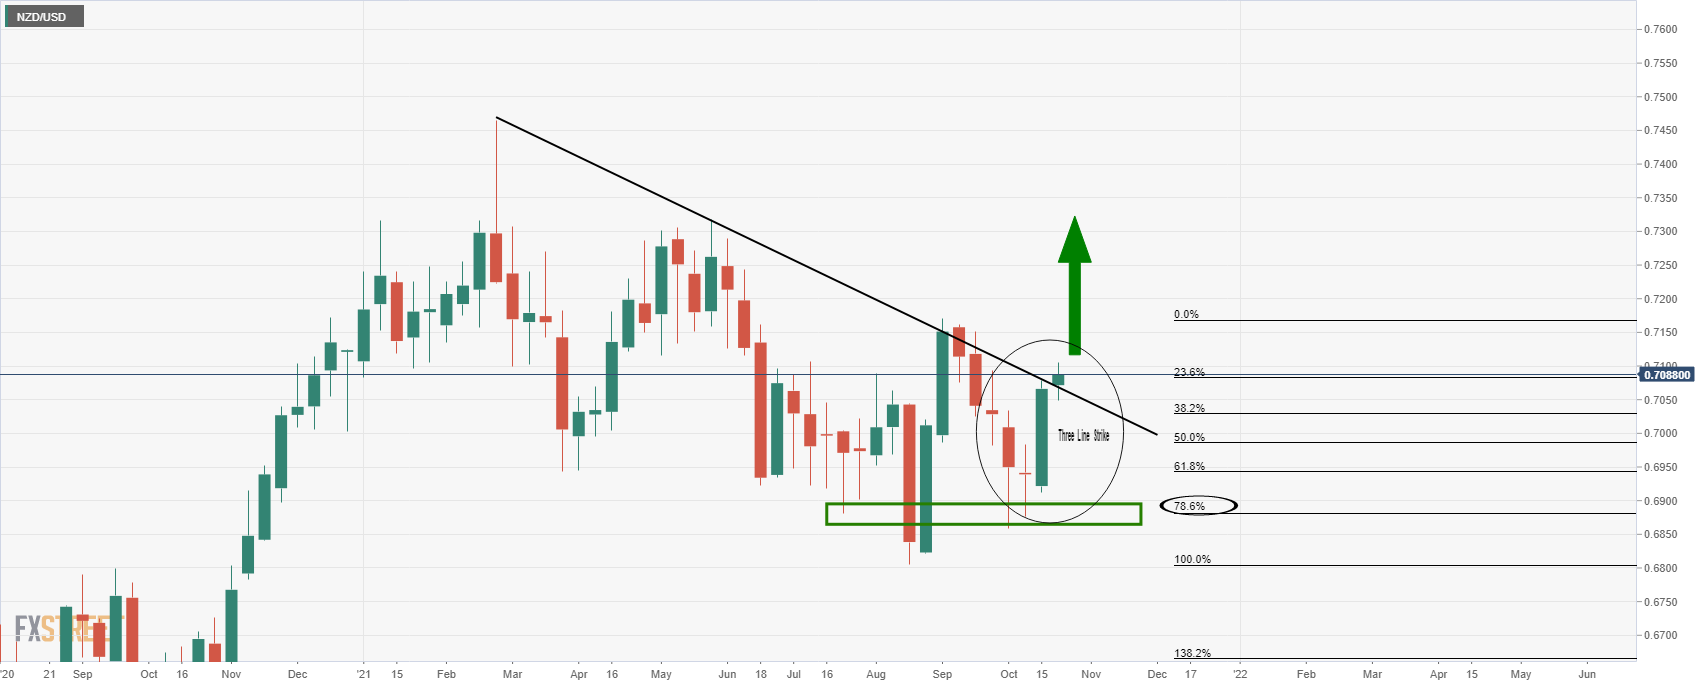
''Meanwhile, from a weekly perspective, the price has corrected deeply to a 78.6% Fibonacci from trendline resistance. It then shot higher in a three-line strike as pe the bodies of the candles. In any case, the bullish engulfing rally has penetrated the resistance line so there are prospects of a breakout, in contrast to the daily chart's W-formations.''
After ...
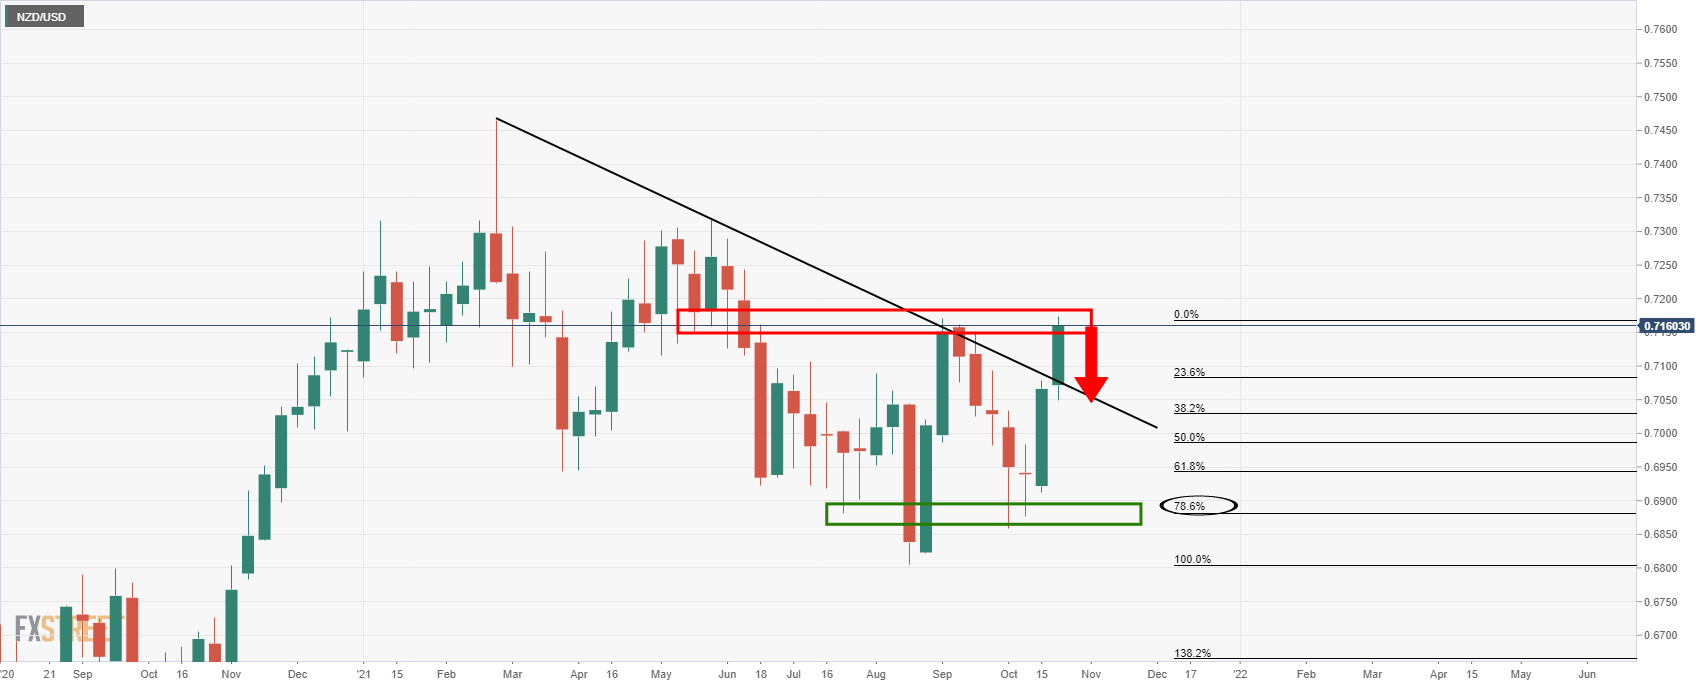
The price has rallied into a wall of resistance which could now serve as a supply zone that will reject NZD/USD for a restest the old dynamic resistance line as counter-trendline support.
NZD/USD daily W-formations
This would rhyme with the bearish reversion W-formations on the daily chart, as illustrated in Monday's daily chart analysis:
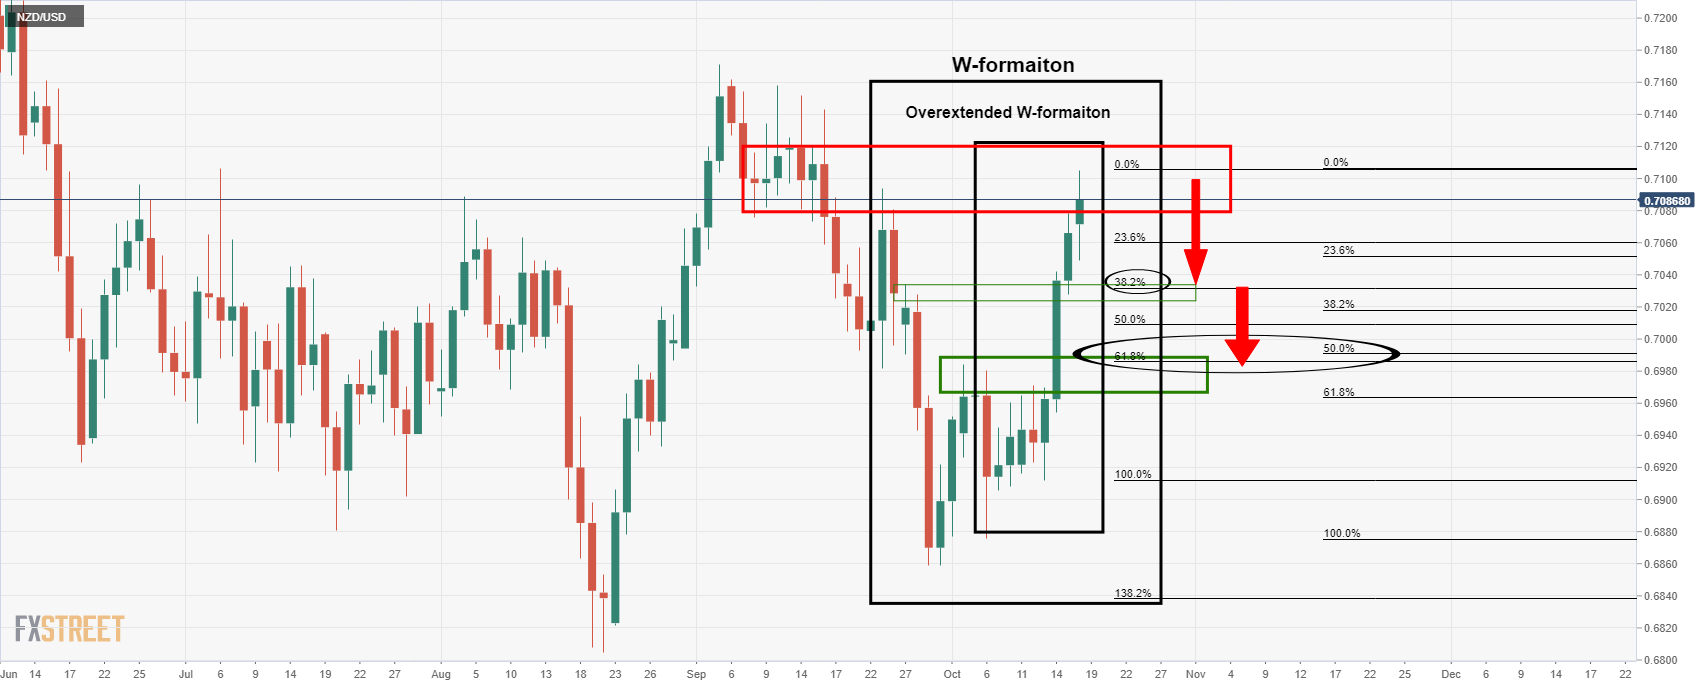
However, given the bullish extension, the analysis needs to be adjusted as follows:
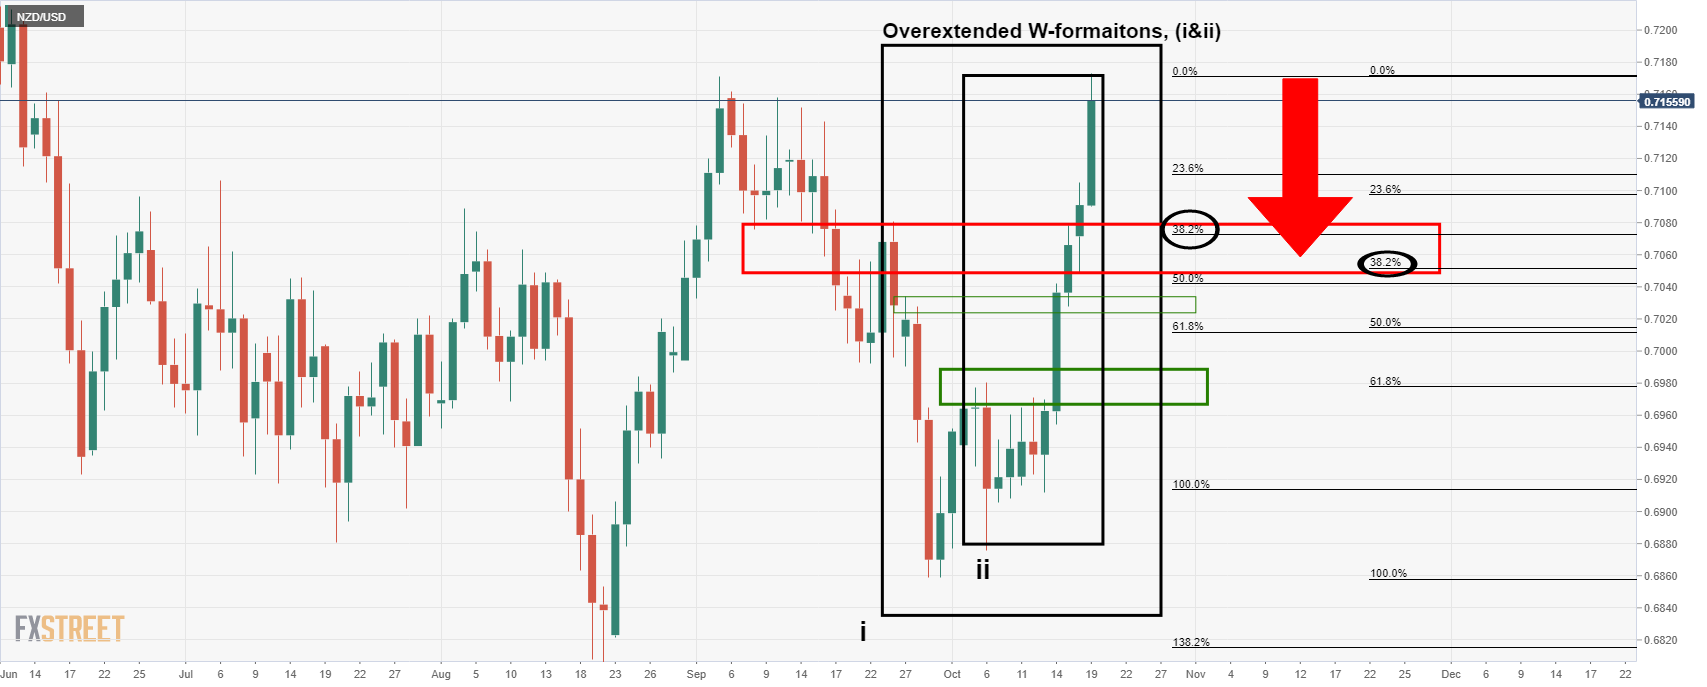
The 38.2% Fibonacci channel between Wi and Wii offers a target area between 0.7080 and 0.7050 as the closest round numbers, the latter being aligned to the weekly counter trendline.