- EUR/USD Price Analysis: A mixed technical picture leaning with slight bearish bias
Market news
EUR/USD Price Analysis: A mixed technical picture leaning with slight bearish bias
- EUR/USD is leaning slightly bearish when taking into account a multi-time-frame analysis.
- EUR/USD 4-hour bearish structure includes the 21-EMA, resistance and tweezer tops.
- EUR/USD daily chart leans bullish above the dynamic support line.
EUR/USD is a mixed picture across the weekly, daily and 4-hour time frames. The following is a top-down analysis that arrives at both a bear and bullish conclusion depending on the time frames. Overall, the bias leans to the downside, however.
EUR/USD weekly chart
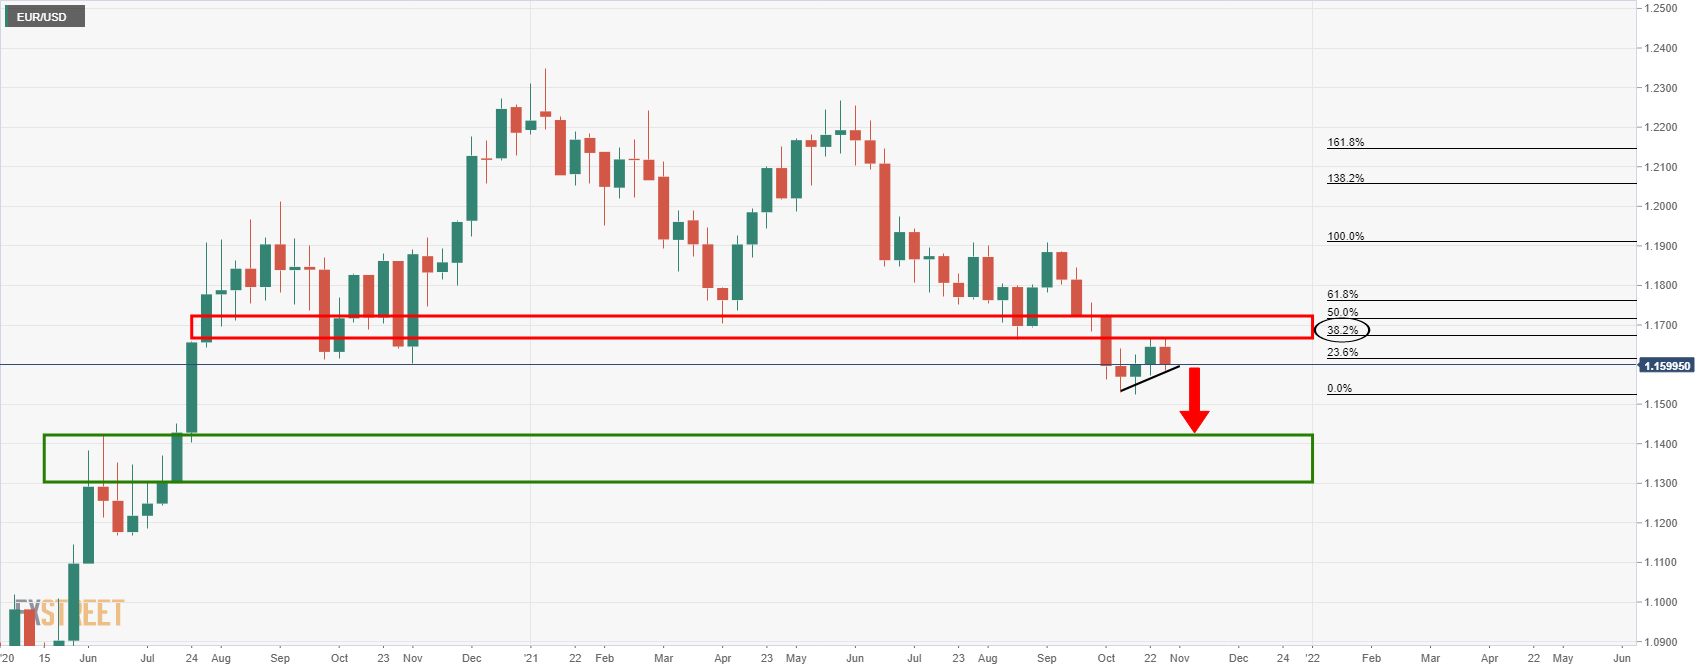
From a weekly perspective, the price is being pressured at resistance and by the 38.2% Fibonacci retracement level of the prior bearish impulse. This could equate to a downside continuation in the coming weeks and towards prior highs expected to act as a support zone near 1.1420.
EUR/USD daily chart
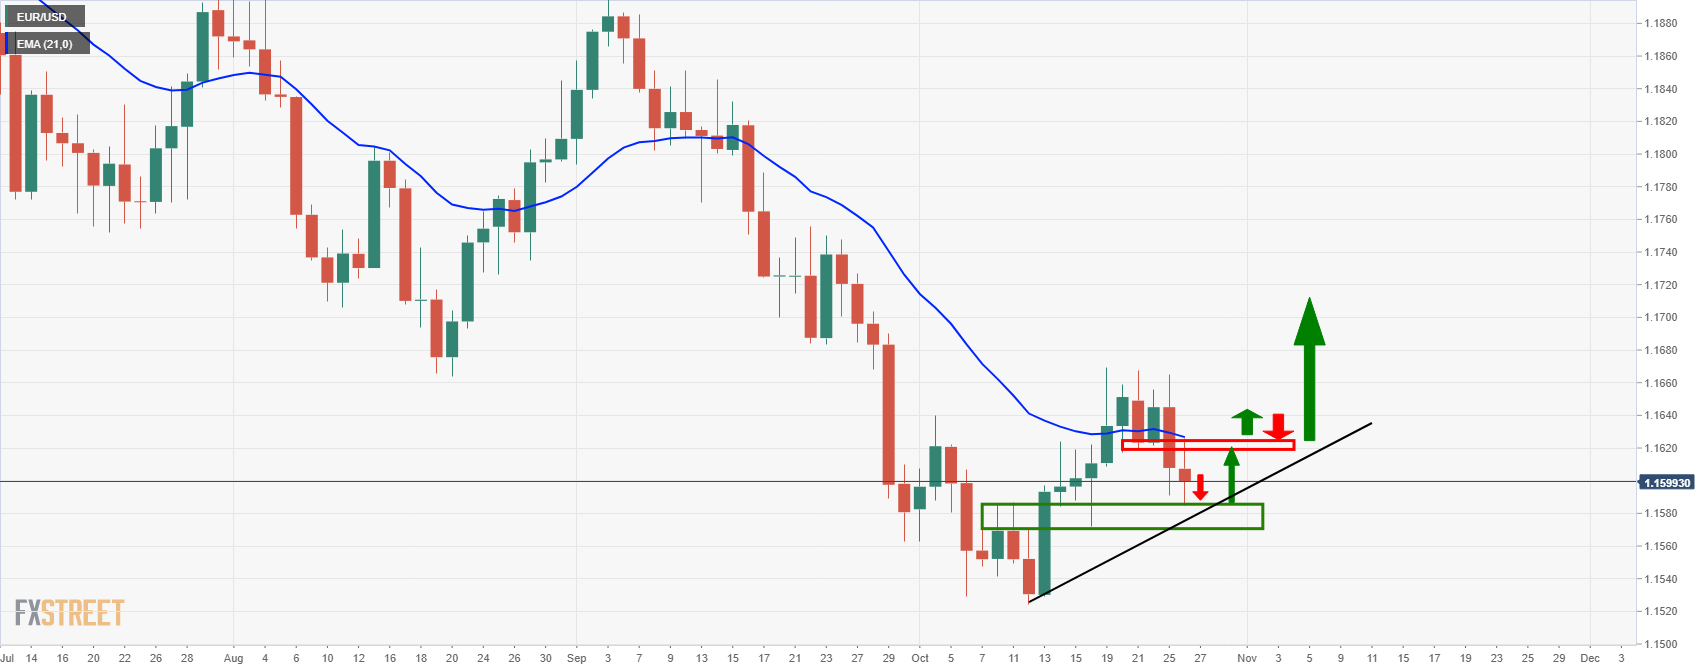
The daily chart, however, is on the verge of a test of support that could result in a move back to the upside to test the M-formation's neckline where it meets the 21-day EMA that would be expected to resist on first attempts. A break of the horizontal support, however, will pressure the dynamic and potentially lead to a downside continuation.
EUR/USD 4-hour chart
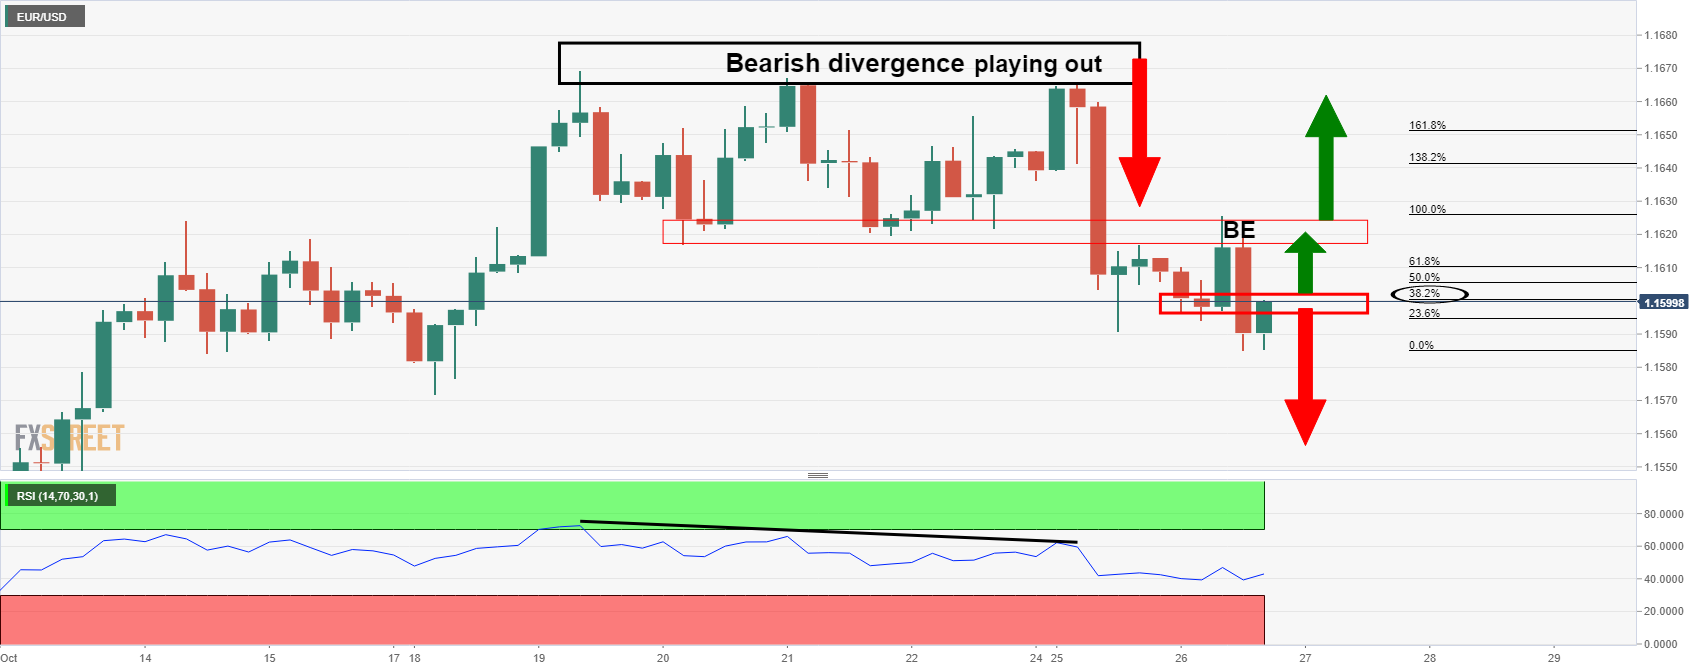
As illustrated above, the bearish divergence with the RSI has already played out. However, the confluence of the bearish engulfing candle is worth noting with the price below the bearish structure as per the 21-EMA, resistance and tweezer tops.