- USD/CAD Price Analysis: Descending channel hurdle might cap gains ahead of US GDP
Market news
USD/CAD Price Analysis: Descending channel hurdle might cap gains ahead of US GDP
- USD/CAD gained some positive traction on Thursday and moved away from the post-BoC lows.
- The descending channel formation warrants caution for bulls amid bearish technical indicators.
The USD/CAD pair built on the previous day's late rebound from the 1.2300 mark, or weekly lows and gained some positive traction on Thursday. The pair climbed to the 1.2380 region during the early part of the European session and has now reversed a major part of the post-BoC losses.
An extension of the corrective pullback in crude oil prices undermined the commodity-linked loonie and turned out to be a key factor that provided a modest lift to the USD/CAD pair. On the other hand, a goodish rebound in the US Treasury bond yields extended some support to the US dollar and remained supportive of the pair's intraday positive move.
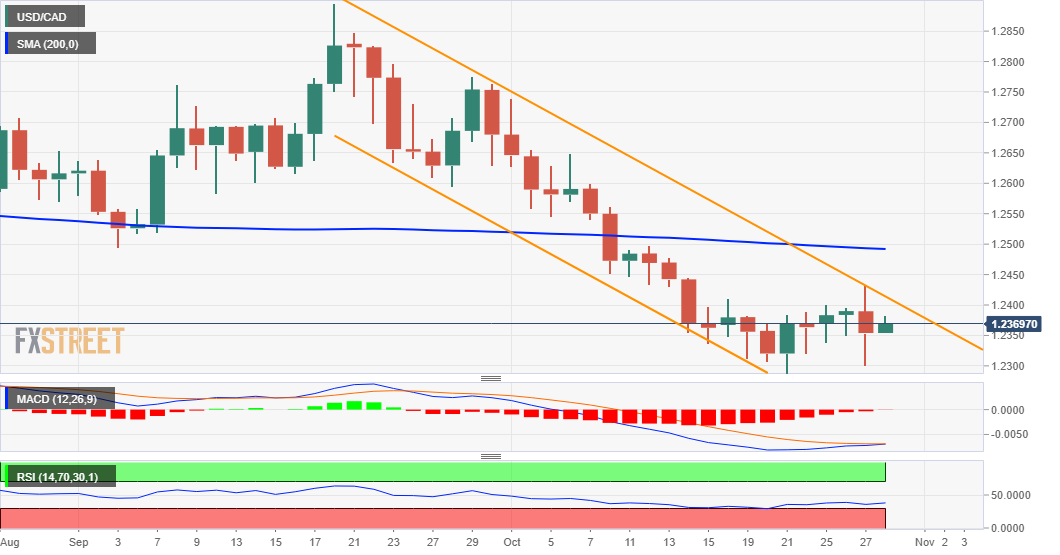
Looking at the technical picture, the recent recovery from four-month lows faltered near the top end of a downward sloping channel in reaction to a more hawkish Bank of Canada on Wednesday. The mentioned barrier, currently around the 1.2410 region, should act as a pivotal point for traders as the focus remains glued to the Advance US Q3 GDP report.
Meanwhile, oscillators have been gaining positive traction lately and favour intraday bullish traders. That said, technical indicators on the daily chart – though have been recovering lately – are holding in the bearish territory. This makes it prudent to wait for a convincing break through the channel resistance before positioning for any further gains.
Above the mentioned barrier, the USD/CAD pair might then accelerate the momentum towards challenging the very important 200-day SMA, around the key 1.2500 psychological mark. Some follow-through buying will suggest that the recent leg down from September monthly swing lows has run its course and trigger a fresh bout of a short-covering move around the major.
On the flip side, the 1.2340 horizontal zone seems to protect the downside ahead of the 1.2300 round-figure mark. Failure to defend the said support levels will be seen as a fresh trigger for bearish traders and turn the USD/CAD pair vulnerable to break below the 1.2300 mark. The downward trajectory could get extended towards the ascending channel support, around the 1.2220 region.
USD/CAD daily chart

Technical levels to watch