- USD/CAD Price Analysis: Bulls eye a run to 1.25 the figure on weekly outlook
Market news
USD/CAD Price Analysis: Bulls eye a run to 1.25 the figure on weekly outlook
- USD/CAD is setting up to be a bullish play towards a weekly 1.2500 target.
- The price has some work to do on the lower time frames.
USD/CAD ha started to consolidate the weekly drop and there are bullish tendencies throughout the weekly, daily and hourly charts as displayed below within the following top-down analysis:
USD/CAD weekly chart
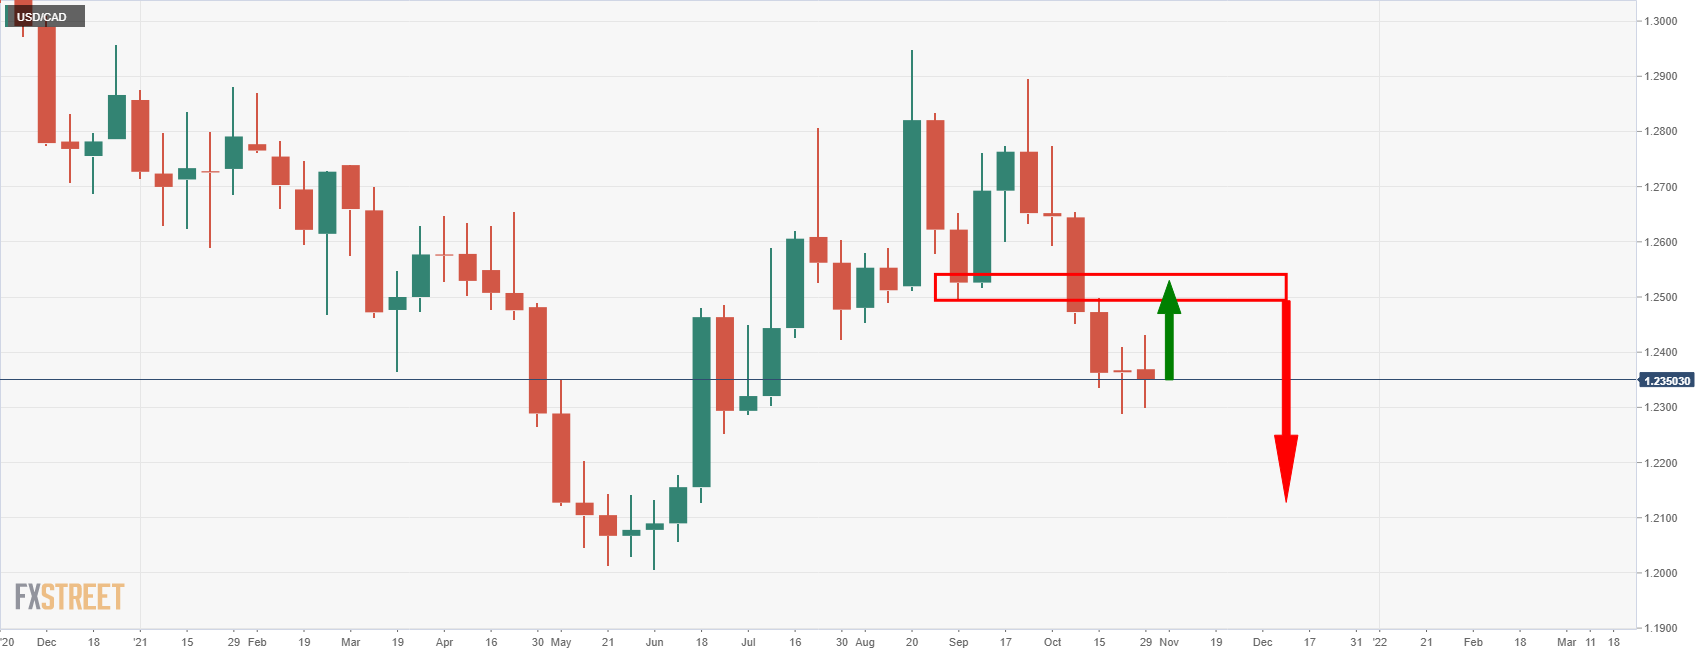
The price on the weekly chart is consolidating and could be on the verge of an upside correction to test the neckline of the M-formation as illustrated on the chart.
USD/CAD daily chart
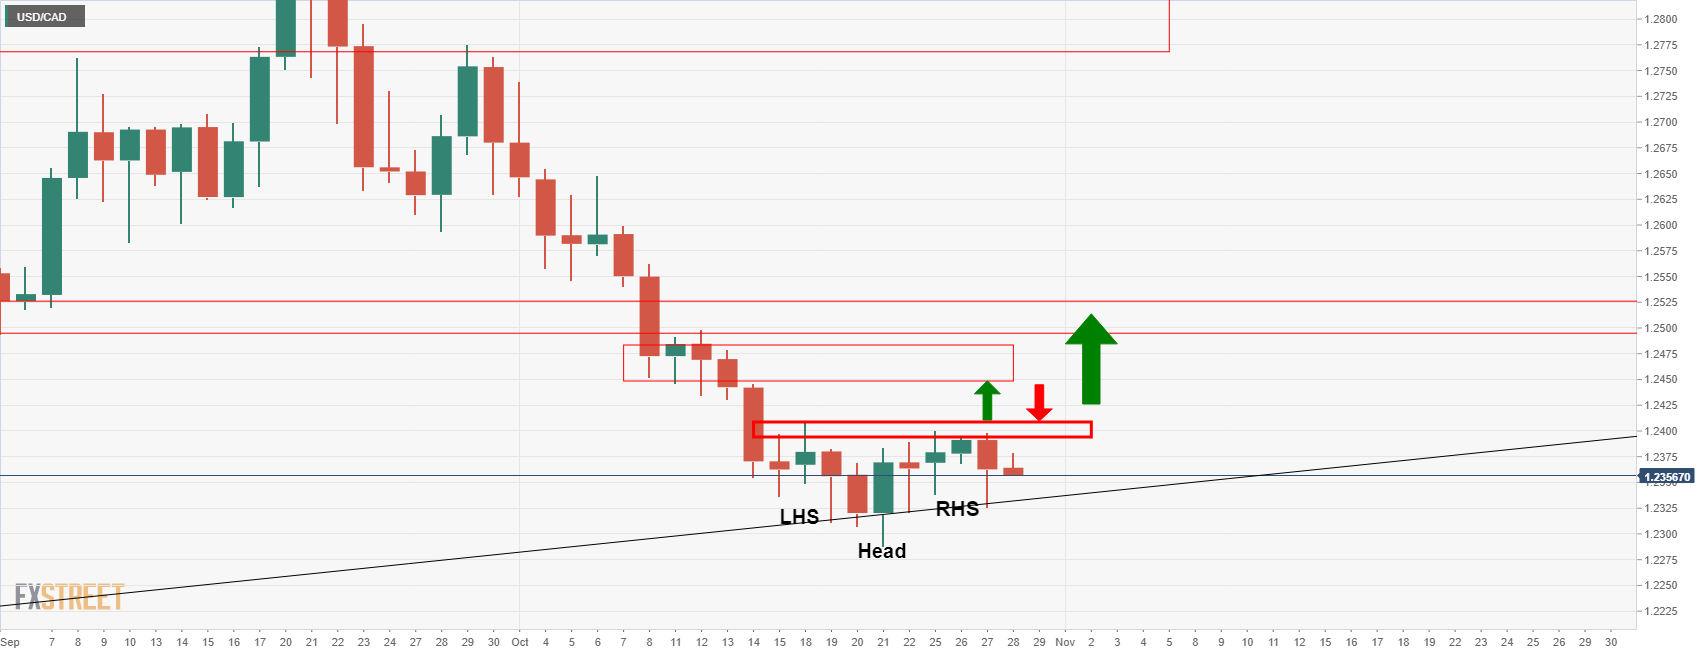
The daily chart is offering a head and shoulders pattern, albeit in reverse, which is a bullish pattern and offers conviction to the upside bias as displayed on the weekly chart above.
USD/CAD 1HR chart
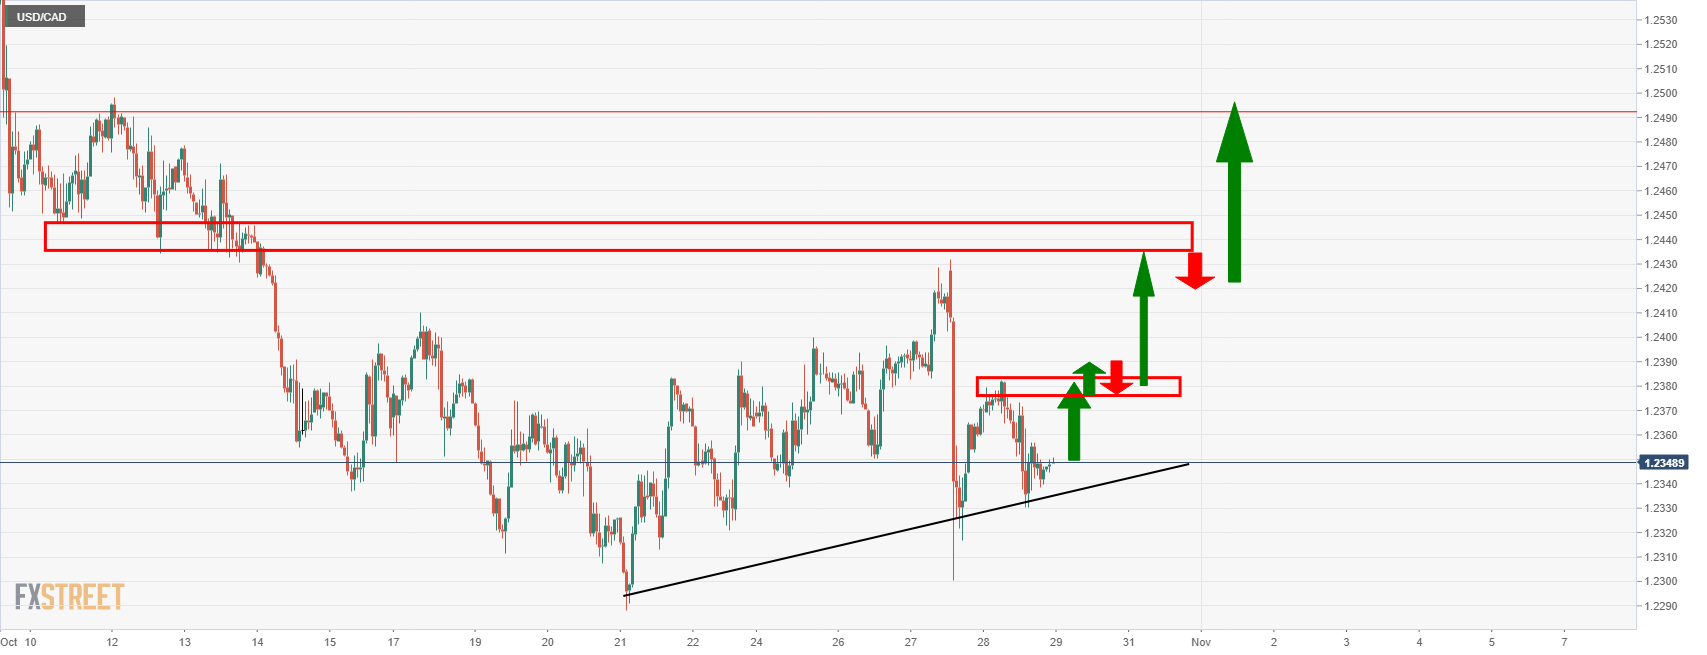
From a lower time frame perspective, the price has a lot of work to do in order to move into the M-formation's neckline. Firstly, we have resistance near 1.2380 that guards a low volume area towards the 1.2450s. This could offer a scalping opportunity on the lower time frames while waiting for a swing trade opportunity on a 1-hour chart basis.