- Gold Price Forecast: XAU/USD pivots around $1800, levels to watch – Confluence Detector
Market news
Gold Price Forecast: XAU/USD pivots around $1800, levels to watch – Confluence Detector
- Gold price cautious amid US yield curve flattening, month-end flows in play.
- Focus shifts to the US PCE inflation and FOMC decision fresh moves in gold.
- Gold price to maintain range play around $1800 ahead US PCE inflation.
With markets reassessing the Fed’s tightening expectations after the US Q3 GDP miss, gold price lacks impetus so far this Friday, pivoting around the $1800 level. The bond market rout extends, with the yield curve flattening in play, which helps put a floor under gold price. The bright metal now looks forward to the Fed’s preferred inflation gauge, the Core PCE index, for fresh trading impulse. Meanwhile, the month-end flows and pre-FOMC cautious trading could influence gold’s performance.
Gold Price: Key levels to watch
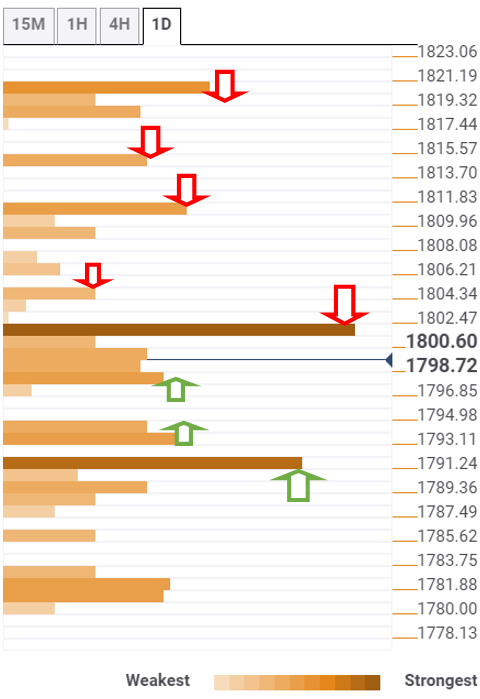
The Technical Confluences Detector shows that gold is trading listlessly below the powerful hurdle at $1802, where the previous high four-hour, Fibonacci 23.6% one-week and SMA5 four-hour converge.
Acceptance above the latter is critical to extending the previous gains towards the Fibonacci 23.6% one-day at $1804.
The next stop for gold bulls is envisioned at $1809, which is the confluence of the previous day’s high, pivot point one-day R1 and Bollinger Band one-day Upper.
The previous week’s high of $1814 will then grab the buyers’ attention.
Further up, the bulls will look to clear a bunch of resistance levels around $1820, which is the intersection of the pivot point one-day R2, pivot point one-month R1 and pivot point one-week R1.
Alternatively, the immediate decline could be capped at $1796, which is the meeting point of the previous low four-hour and SMA5 one-day.
The next significant support is seen at $1793, the convergence of the previous day’s low and SMA200 one-day.
Further south, the confluence of the Fibonacci 61.8% one-month and pivot point one-day S1 at $1791-$1790 will be the level to beat for gold bears.
Here is how it looks on the tool
About Technical Confluences Detector
The TCD (Technical Confluences Detector) is a tool to locate and point out those price levels where there is a congestion of indicators, moving averages, Fibonacci levels, Pivot Points, etc. If you are a short-term trader, you will find entry points for counter-trend strategies and hunt a few points at a time. If you are a medium-to-long-term trader, this tool will allow you to know in advance the price levels where a medium-to-long-term trend may stop and rest, where to unwind positions, or where to increase your position size.