- USD/CHF Price Analysis: Looks to 0.9300 on confirming nearby falling wedge
Market news
USD/CHF Price Analysis: Looks to 0.9300 on confirming nearby falling wedge
- USD/CHF picks up bids to refresh intraday high, snaps two-day downtrend.
- MACD backs confirmation of bullish chart pattern, three-day-old horizontal hurdle in focus.
- 200-HMA joins 50% Fibonacci retracement level to challenge bears.
USD/CHF holds onto the first daily gains in three near the intraday top surrounding 0.9270 during early Friday.
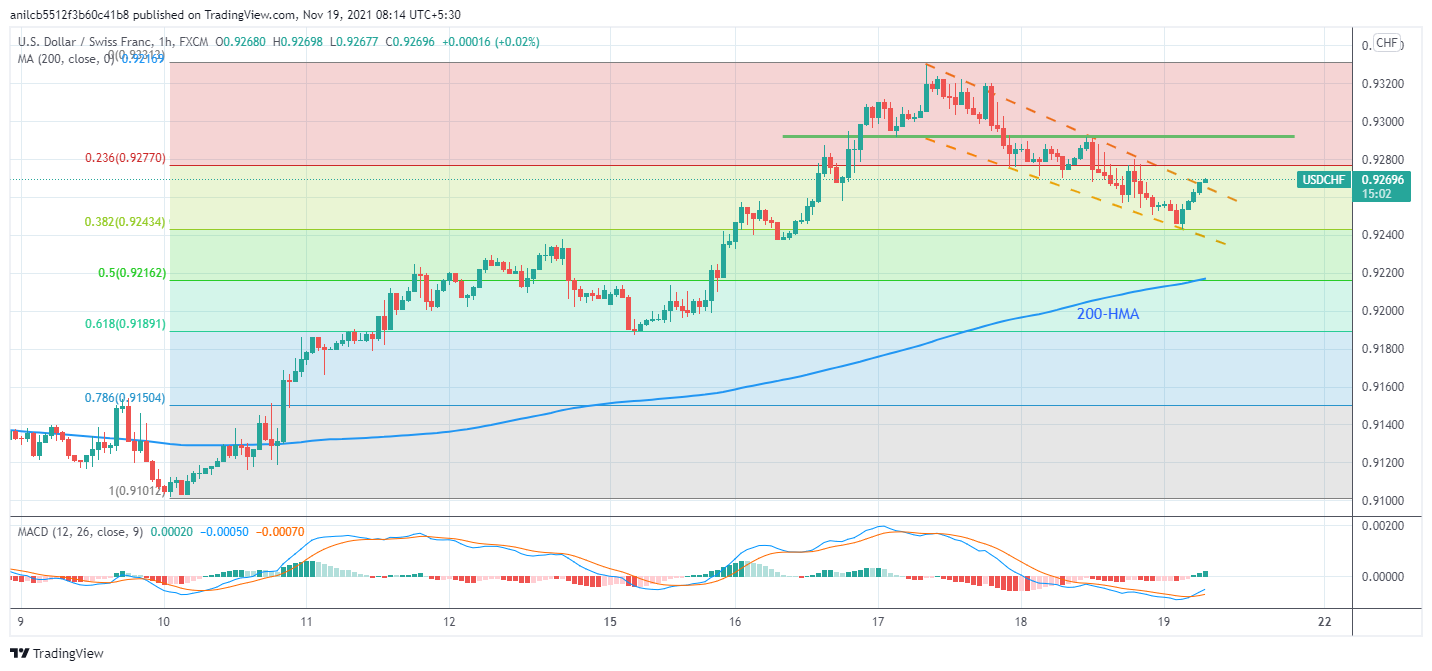
The Swiss currency (CHF) pair’s latest run-up could be linked to its ability to cross the two-day-old descending trend line, which in turn confirms a short-term bullish chart formation called a falling wedge.
With the bullish MACD signals joining falling wedge confirmation, USD/CHF traders are up for further advances towards a horizontal area comprising multiple levels marked since Tuesday, near 0.9300.
Following that, the monthly high near 0.9330 and September’s peak close to 0.9370 will be in focus.
Alternatively, pullback moves will aim for the resistance-turned-support line close to 0.9265 before directing the USD/CHF sellers towards 38.2% Fibonacci retracement of November 10-17 upside, surrounding 0.9245.
If at all the pair drops below 0.9245, a convergence of 200-HMA and 50% Fibo. near 0.9215, will become a tough nut to crack for the bears.
USD/CHF: Hourly chart
Trend: Further upside expected