- USD/CAD Price Analysis: Weekly 38.2% Fibo reached
Market news
8 December 2021
USD/CAD Price Analysis: Weekly 38.2% Fibo reached
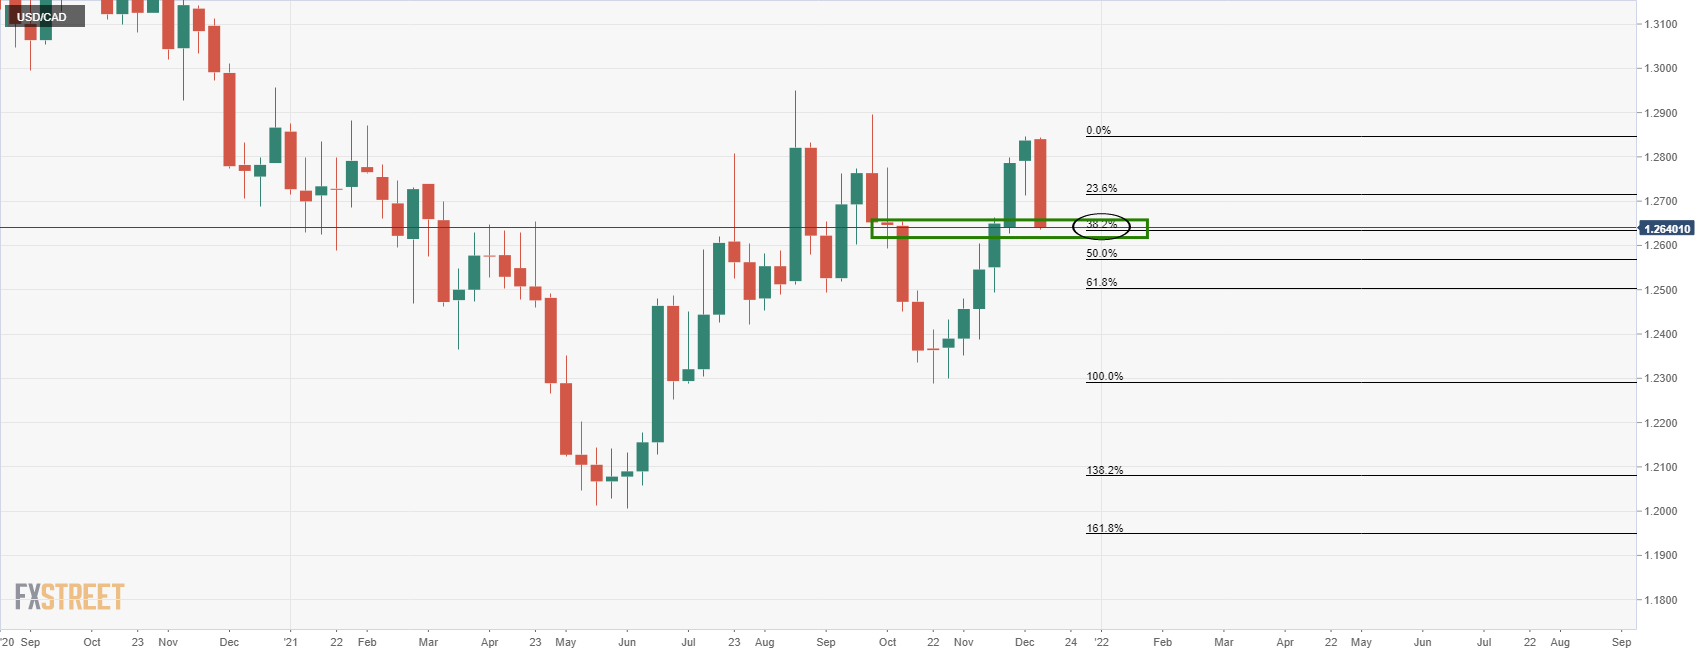
- USD/CAD runs hard into support territory on the weekly and daily time frames.
- Bulls could be looking for an entry should the price start to correct and eye 1.2750.
USD/CAD has dropped this week all the way to the 38.2% Fibonacci retracement of the prior bullish impulse. Moving into the daily time frame, the area has been a significant zone for where transactions took place and it could therefore be expected to act as a support. The following illustrates the price action and confluences of technical influences that could lead to a correction towards 1.2750 in the coming days.
USD/CAD weekly chart
The daily chart illustrates the support more clearly and a correction from here could target a 50% mean reversion near 1.2740 in the coming days:
USD/CAD daily chart
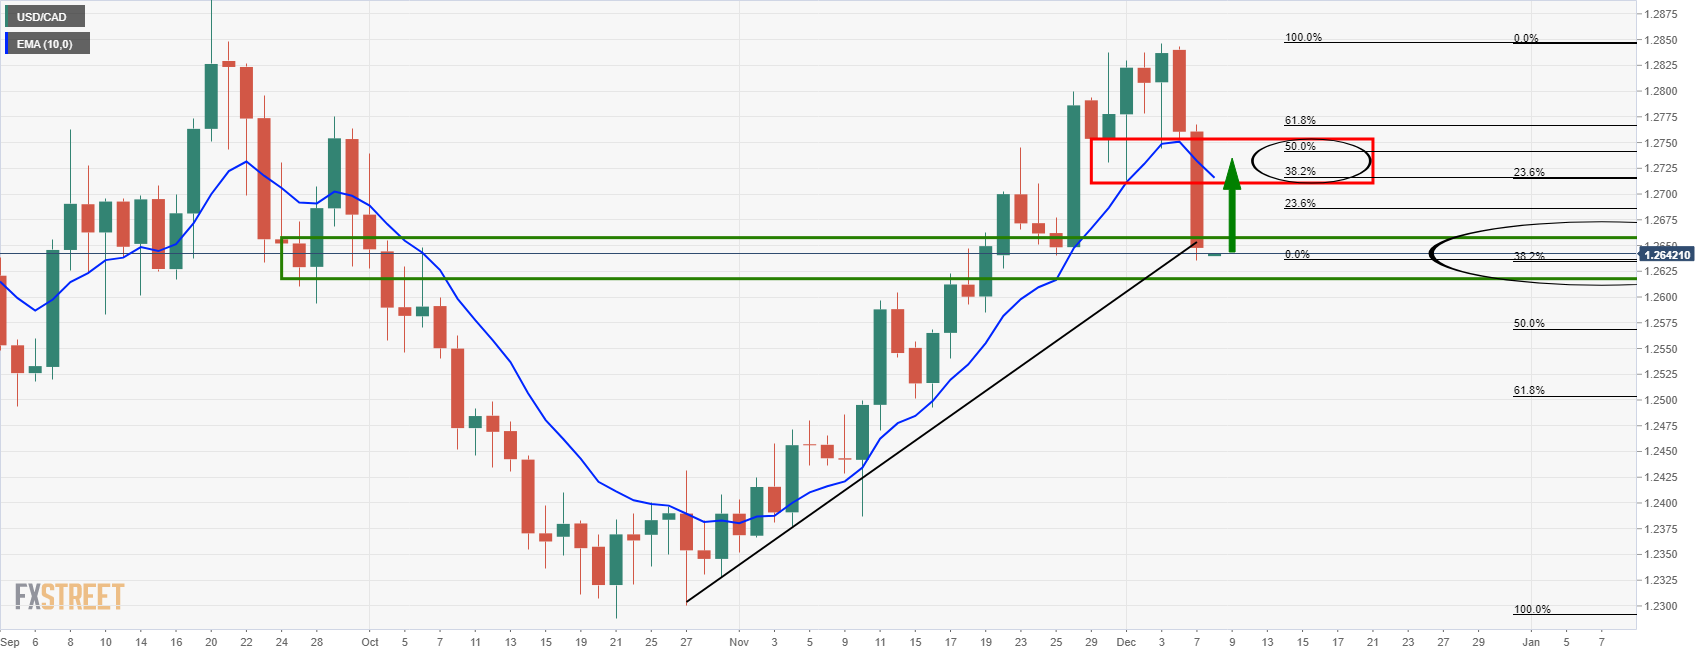
The expected resistance zone also has the 10-EMA in confluence which would be expected to reinforce that area on initial tests.
Market Focus
 Material posted here is solely for information purposes and reliance on this may lead to losses. Past performances are not a reliable indicator of future results. Please read our full disclaimer
Open Demo Account & Personal Page