- GBP/USD Price Analysis: Bulls eye 1.33 the fgure
Market news
GBP/USD Price Analysis: Bulls eye 1.33 the fgure
- GBP/USD bulls are looking for a run to test 1.33 the figure.
- Bears need to commit at this juncture or face continued pressures for the sessions ahead.
GBP/USD is not showing any signs of an imminent break of daily ranges. However, the 4-hour chart's imbalance between spot and 1.33 the figure is compelling.
The following illustrates the market structures from a weekly down to a 4-hour perspective.
GBP/USD daily chart
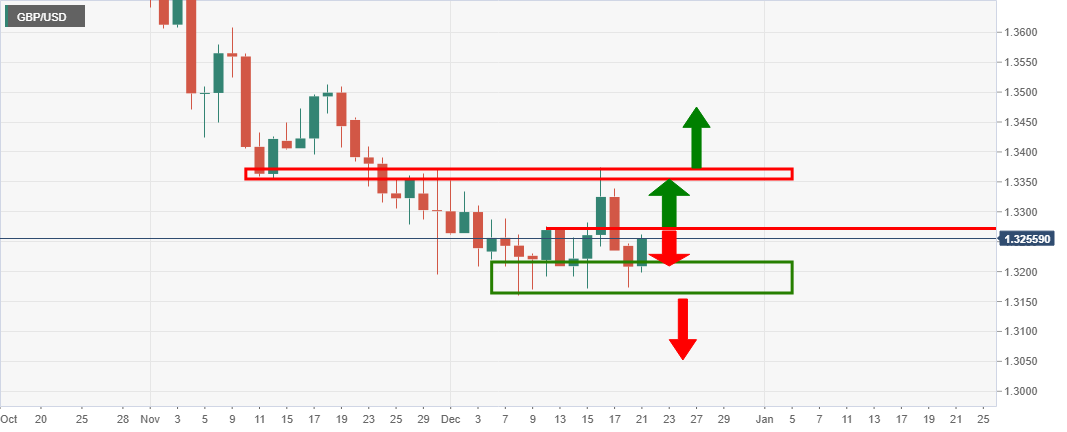
As illustrated, the price is not giving any signals from a daily perspective, trapped in a range of consolidation.
GBP/USD weekly chart
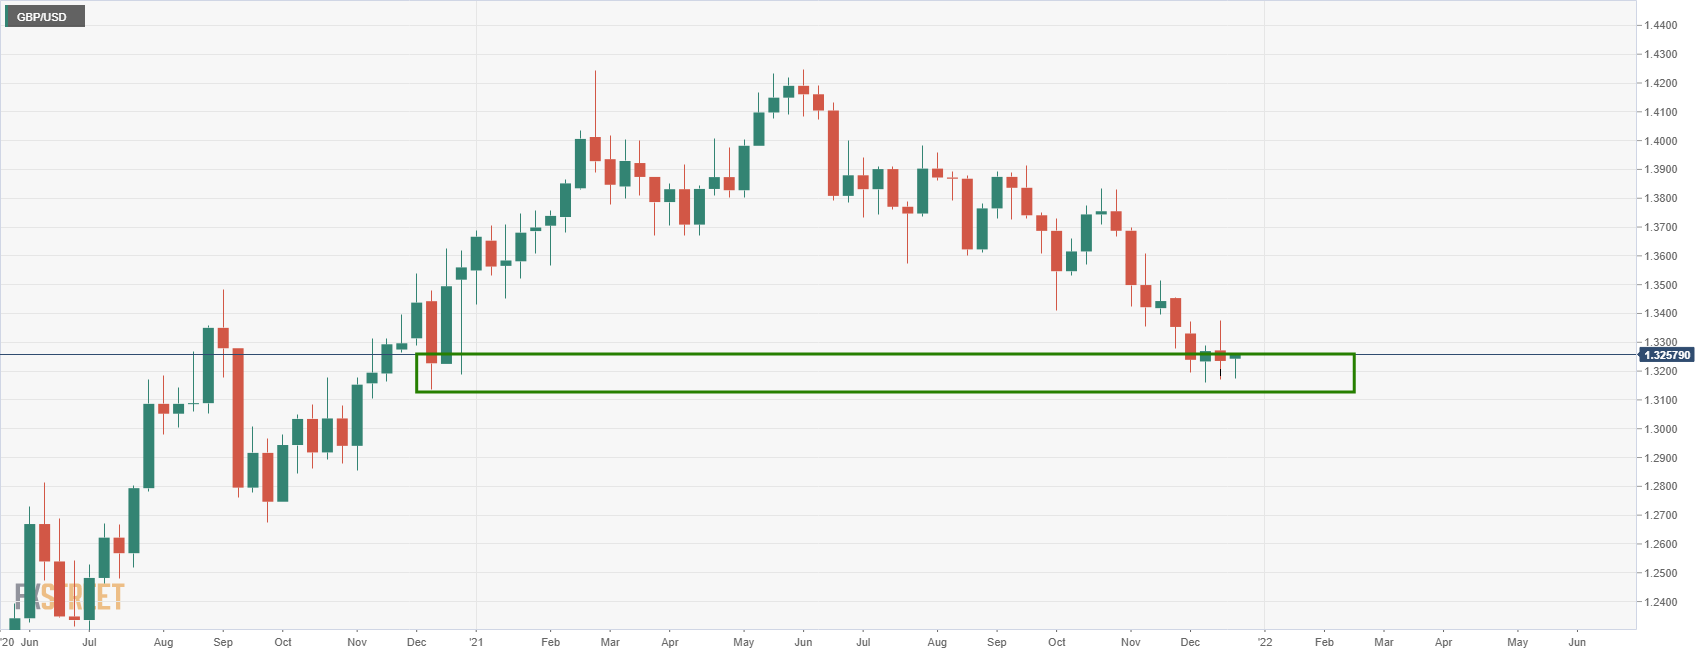
The weekly chart shows that there is a firm area of support at this juncture. Therefore, it is typical that the price will struggle to breakout to the downside before enough supply has been allocated in the market.
GBP/USD H4 chart
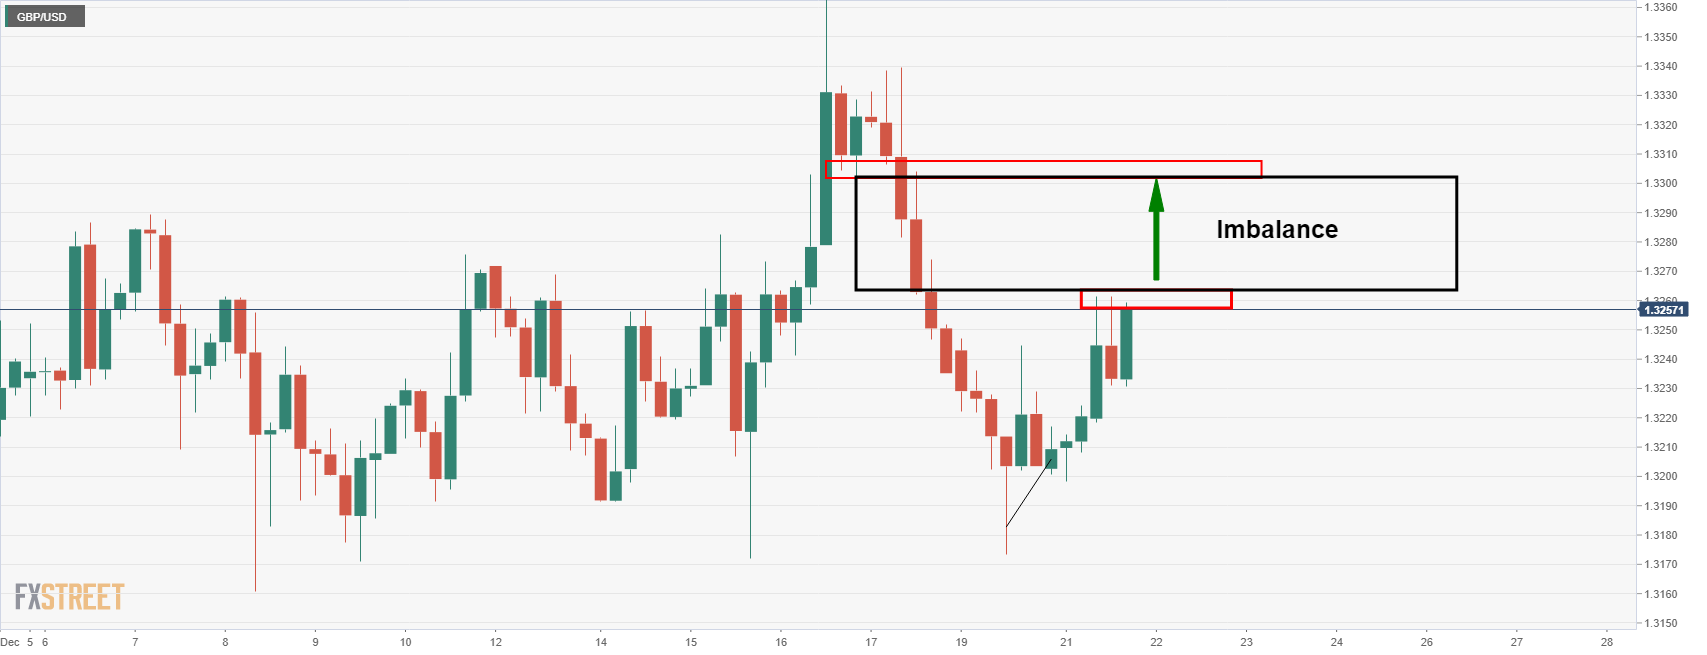
The 4-hour chart shows that the price is trying to mitigate the imbalance with today's spike to test resistance. On the break of resistance, there is room to go until 1.33 the figure and some change.
 Material posted here is solely for information purposes and reliance on this may lead to losses. Past performances are not a reliable indicator of future results. Please read our full disclaimer