- NZD/USD Price Analysis: Justifies Doji below 100-SMA to print mild losses
Market news
NZD/USD Price Analysis: Justifies Doji below 100-SMA to print mild losses
- NZD/USD eyes to refresh intraday low, pares the biggest daily gains in two months.
- Bearish candlestick formation below the key SMA, amid RSI retreat, favor sellers.
- The 0.6830 becomes the key resistance to watch during further advances.
NZD/USD drops 0.17% intraday, matching its Aussie counterpart, as sellers attack 0.6750 level during early Wednesday. The kiwi pair jumped the most among the G10 pairs, not to forget posted the biggest daily gains since late October.
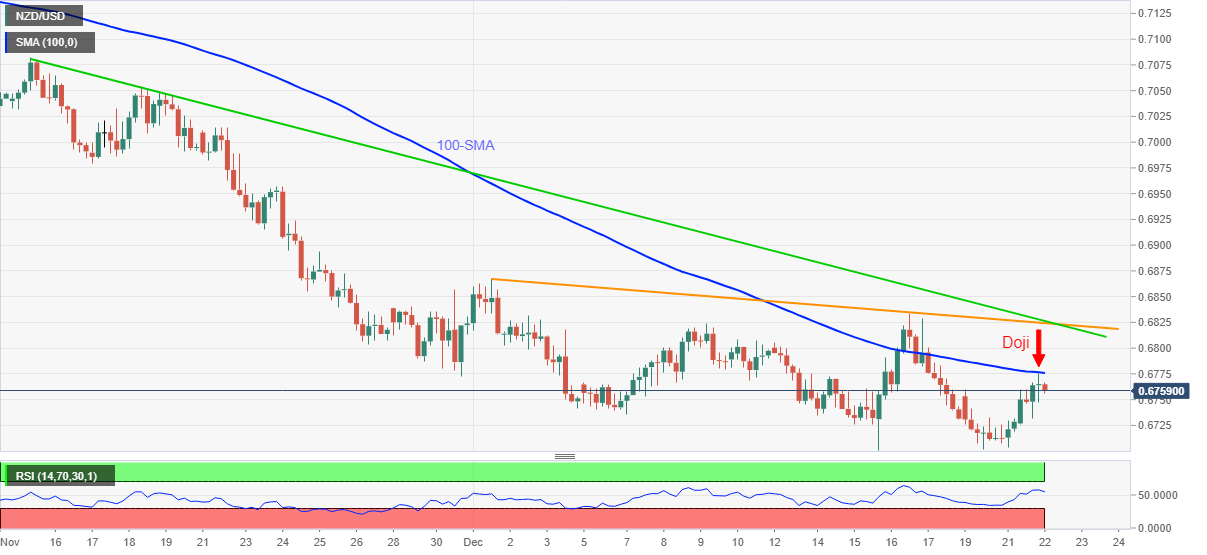
However, failure to cross the 100-SMA portrayed a bearish Doji candlestick on the four-hour play, which in turn joins the RSI retreat to hint at the quote’s further weakness.
That said, the 0.6725 and the 0.6700 round figure are at the hand’s reach for NZD/USD sellers.
During the pair’s further weakness, the 61.8% Fibonacci Expansion (FE) of November 23 to December 16 moves, around 0.6670, will offer an intermediate halt ahead of a likely slump towards November 2020 low near 0.6590.
Alternatively, a clear upside break of the 100-SMA level of 0.6775 won’t be enough for the NZD/USD buyer’s return as a convergence of two resistance lines, from early December and mid-November, around 0.6830, will be a crucial hurdle for the further upside.
Also acting as a short-term resistance is the monthly high of 0.6868, a break of which will direct the pair towards the late November’s swing high near 0.6960.
NZD/USD: Four-hour chart
Trend: Further weakness expected
 Material posted here is solely for information purposes and reliance on this may lead to losses. Past performances are not a reliable indicator of future results. Please read our full disclaimer