- GBP/JPY Price Analysis: Bears taking charge at daily resistance
Market news
23 December 2021
GBP/JPY Price Analysis: Bears taking charge at daily resistance
- GBP/JPY is meeting daily resistance and focus is on a correction.
- GBP/JPY bears can target the old resistance and counter trendline.
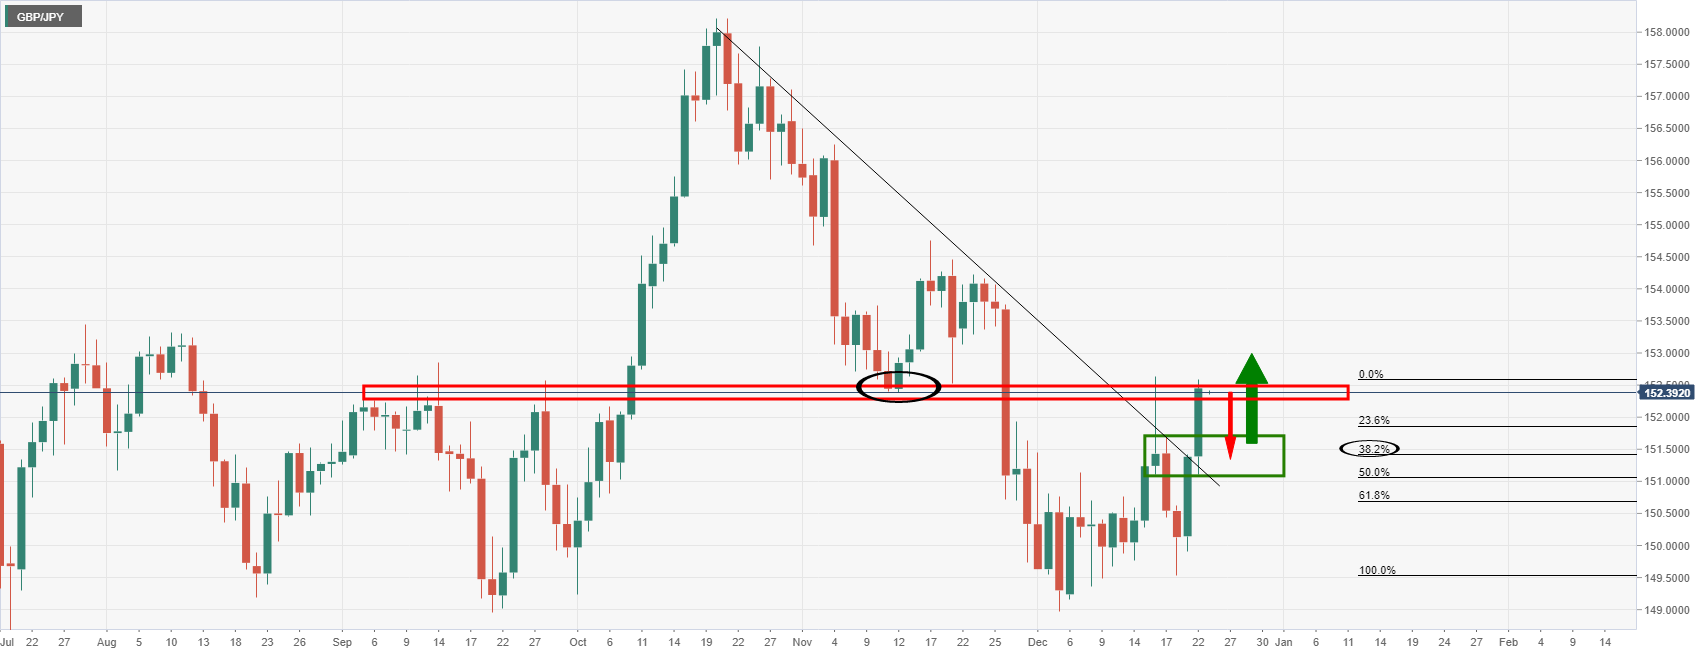
The daily charts illustrate the price meets prior support established in the middle of November. Should the market pull-back, then there are prospects of a restest of the counter trendline and horizontal support. This meets the 38.2% Fibonacci retracement level near 151.40.
GBP/JPY daily chart
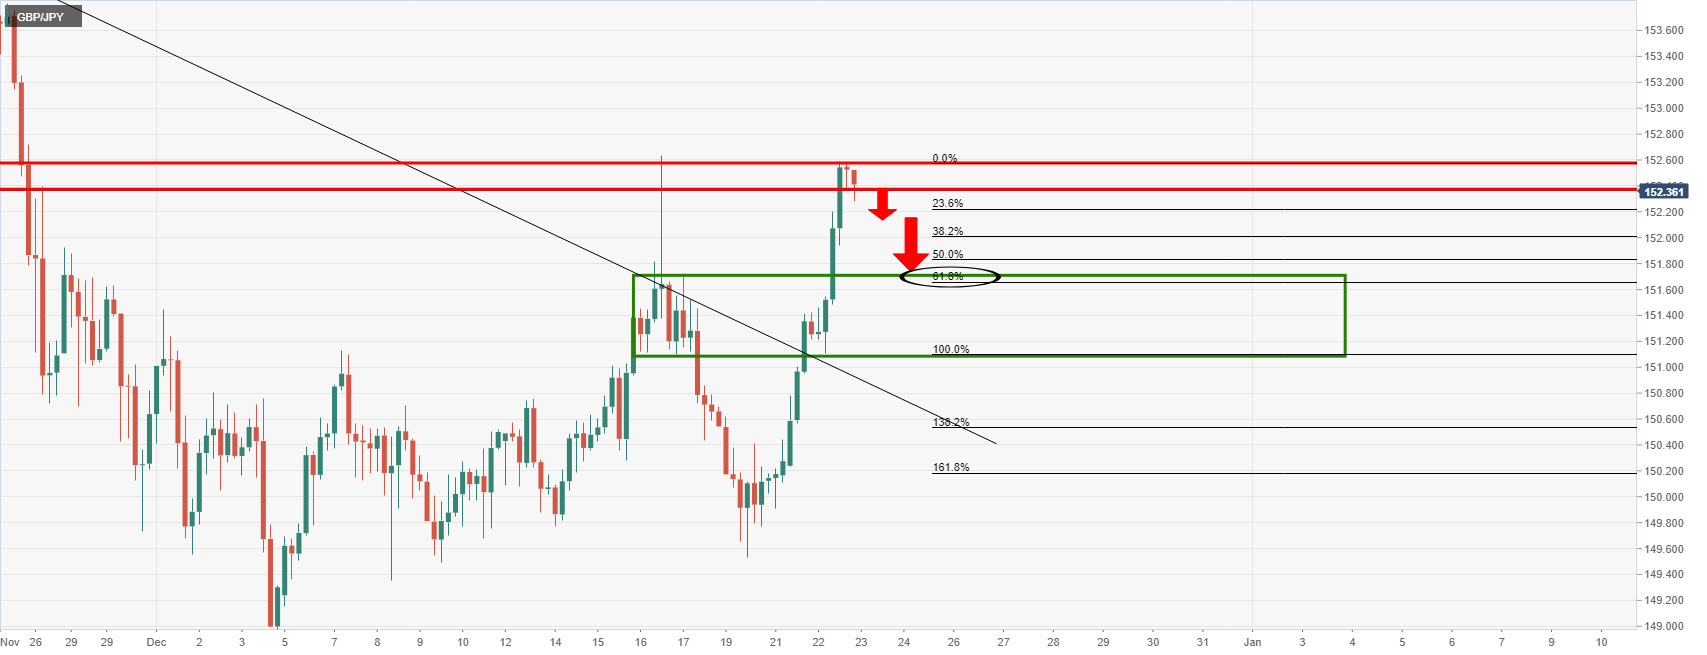
GBP/JPY H4 chart
The 4-hour chart shows that the price is starting to correct. There will be prospects of a 61.8% Fibonacci retracement towards 151.50 and the daily support structure should the bears commit over the coming sessions.
Market Focus
 Material posted here is solely for information purposes and reliance on this may lead to losses. Past performances are not a reliable indicator of future results. Please read our full disclaimer
Open Demo Account & Personal Page