- Silver Price Analysis: XAG/USD seesaws inside ascending triangle below $23.00
Market news
Silver Price Analysis: XAG/USD seesaws inside ascending triangle below $23.00
- Silver buyers seem running out of steam inside a bearish chart pattern.
- Nearly overbought RSI also teases sellers for entry.
- 100-SMA, 23.6% Fibonacci retracement level becomes short-term key support, 200-SMA adds to the upside filters.
Silver (XAG/USD) prices grind higher around $22.90, near the monthly top, during Friday’s Asian session.
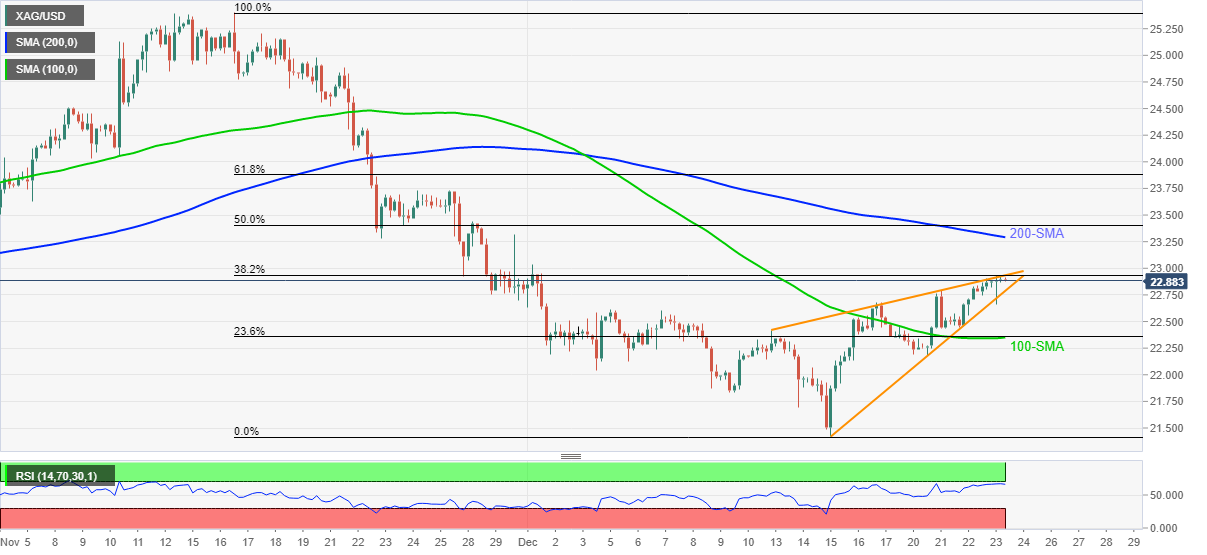
In doing so, the bright metal funnels down to the breaking point of a two-week-old ascending triangle bearish chart pattern.
Other than the failures to stay firmer and bearish formation, nearly overbought RSI conditions also signal the silver seller’s arrival. However, a clear downside break of $22.78 becomes necessary for that.
Even so, a convergence of the 100-SMA and 23.6% Fibonacci retracement (Fibo.) level near $22.35 and $22.00 threshold can test the XAG/USD bears before directing them to the monthly low around $21.40.
Meanwhile, the 38.2% Fibo. and the upper line of the stated triangle, near $22.95, restricts short-term advances of the metal.
Also acting as an upside filter is the $23.00 threshold and 200-SMA level of $23.30.
Silver: Four-hour chart
Trend: Pullback expected
 Material posted here is solely for information purposes and reliance on this may lead to losses. Past performances are not a reliable indicator of future results. Please read our full disclaimer