- US Dollar Index Price Analysis: 50-DMA tests bears around one-month low
Market news
US Dollar Index Price Analysis: 50-DMA tests bears around one-month low
- DXY remains pressured around multi-day low as sellers attack the key support.
- Bearish MACD signals, clear downside break of seven-week-old ascending trend line keep sellers hopeful.
- Further downside will aim for 94.85-80 strong support, 21-DMA guards immediate upside.
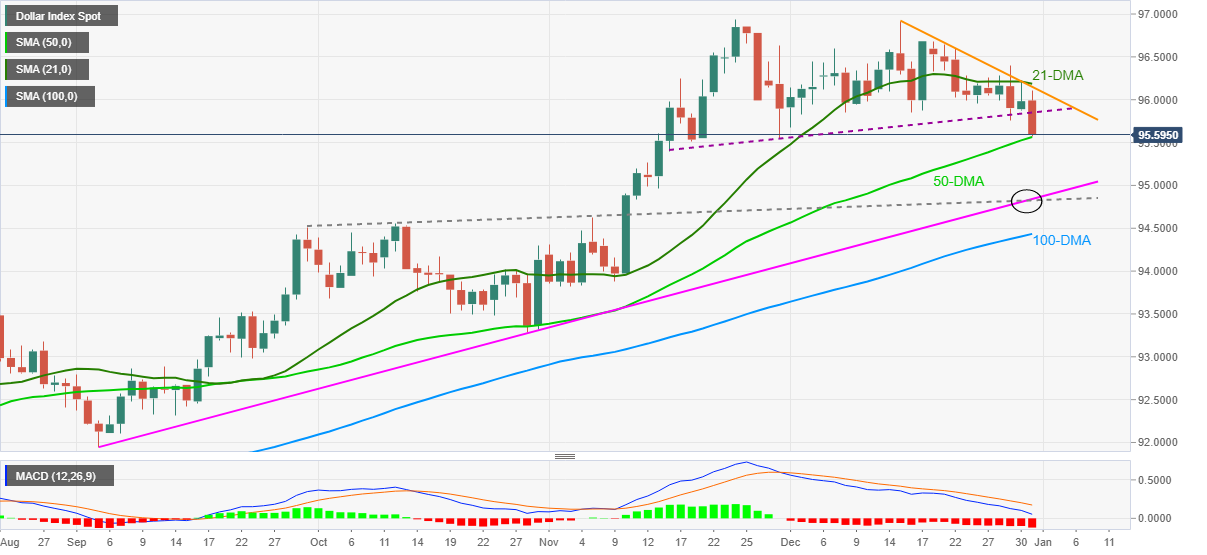
US Dollar Index (DXY) remains pressured around late November levels, close to 95.60, during Monday’s Asian session.
In doing so, the greenback gauge keeps Friday’s downside break of the previously important support line from November 16, now resistance around 95.85.
The trend line breakdown gets support from the bearish MACD signals and repeated failures to cross the 21-DMA to suggest further downside of the US Dollar Index.
That said, the November 12-15 lows near the 95.00 threshold may offer an intermediate halt during the gauge’s anticipated plunge to 94.85-80 zone comprising an ascending support line from early September and a three-month-long previous resistance line
Alternatively, recovery moves need to cross the support-turned-resistance line near 95.85 to recall the buyers.
Even so, a convergence of the 21-DMA and descending resistance line from December 15, around 96.20, will challenge the DXY’s further upside.
DXY: Daily chart
Trend: Further weakness expected
 Material posted here is solely for information purposes and reliance on this may lead to losses. Past performances are not a reliable indicator of future results. Please read our full disclaimer