- NZD/USD Price Analysis: Weekly M-formation in play, bulls look to 0.6950, bears to 0.6700
Market news
4 January 2022
NZD/USD Price Analysis: Weekly M-formation in play, bulls look to 0.6950, bears to 0.6700
- NZD/USD bulls stepping in at critical daily support.
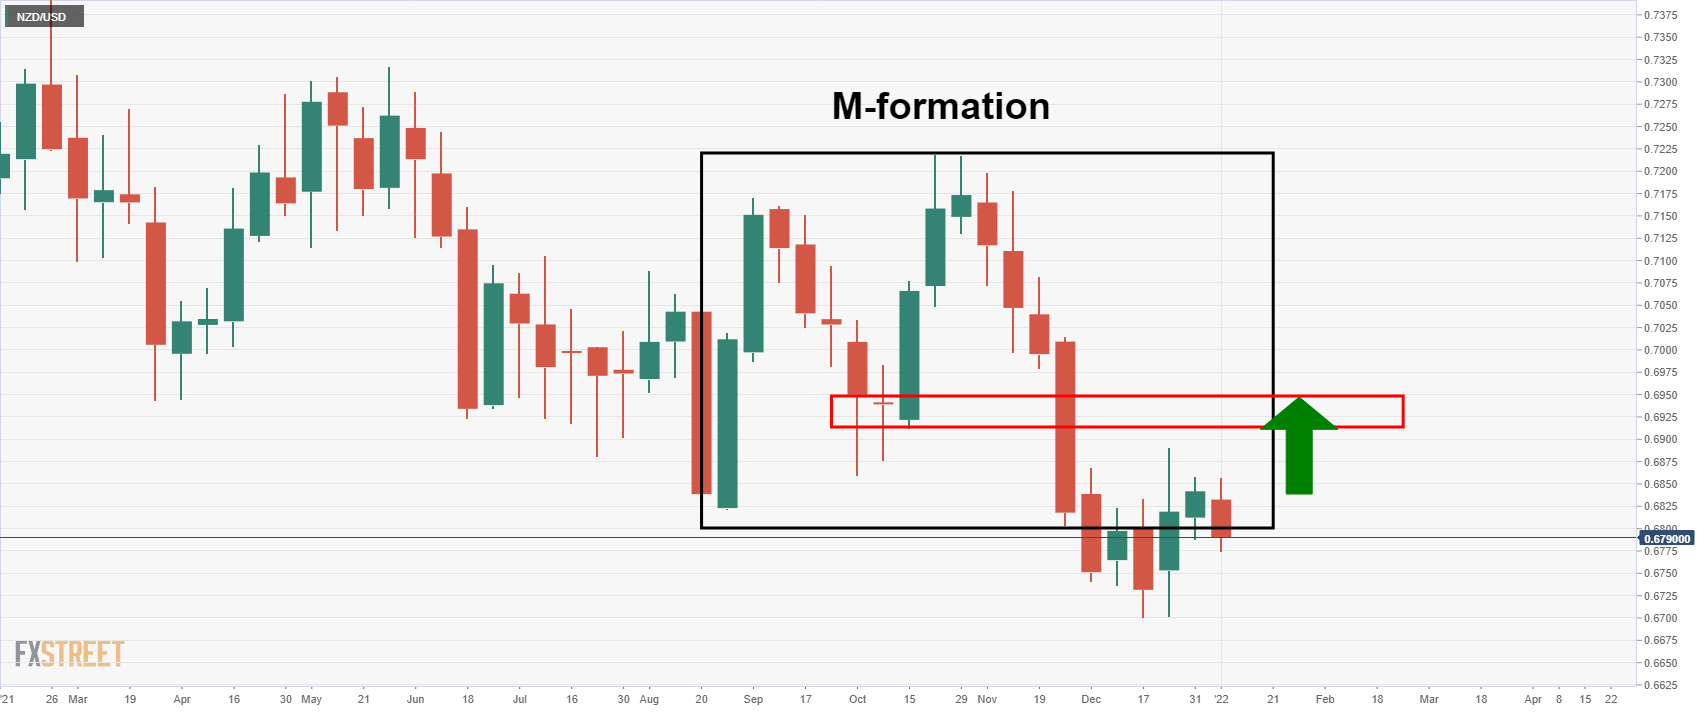
- Bulls will aim for a breakout of recent highs towards 0.6950.
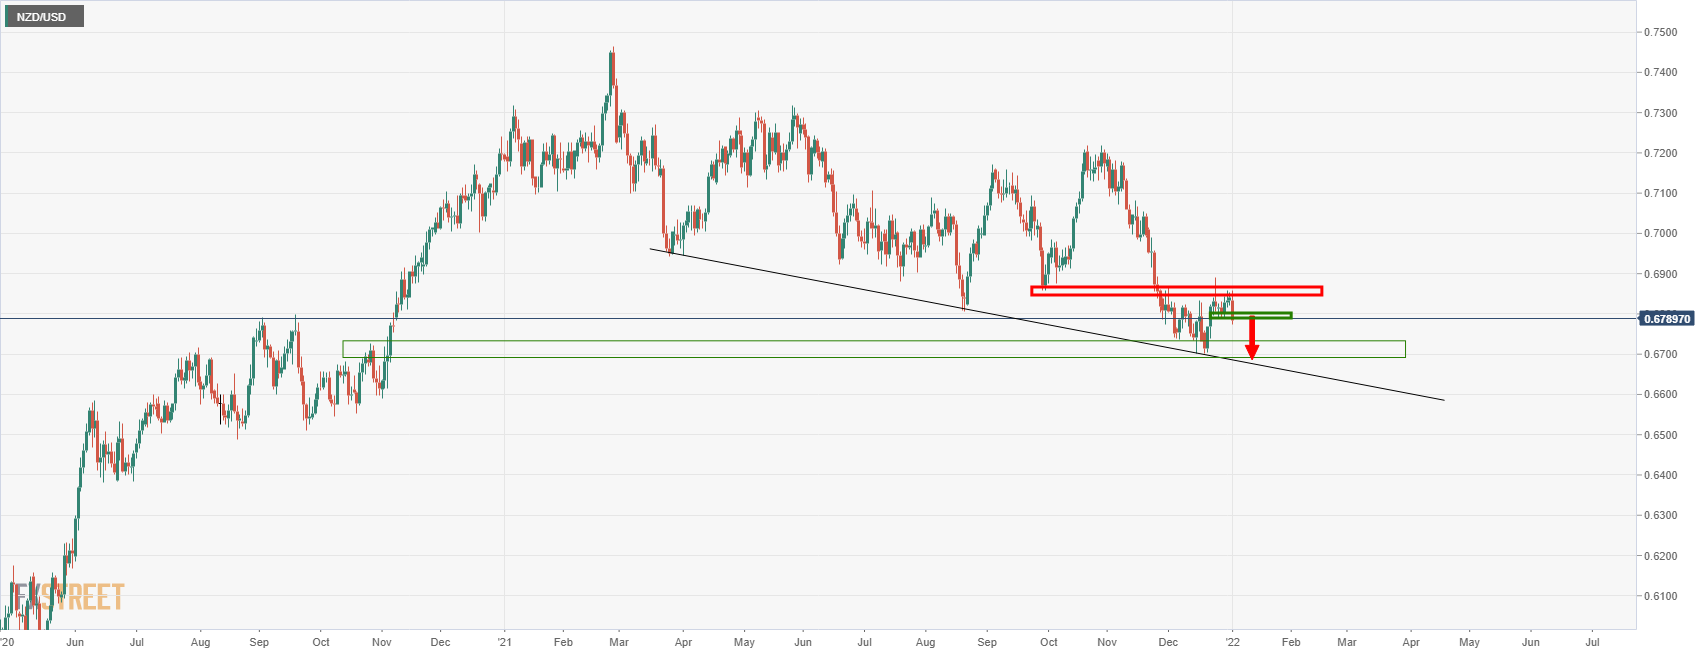
- Bears seeking a break of the daily support are a retest of current lows near 0.67 the figure.
NZD/USD is attempting to correct to the upside and the following illustrates the M-formation's neckline on the weekly chart where bulls could be headed.
NZD/USD weekly chart, M-formation
Daily chart
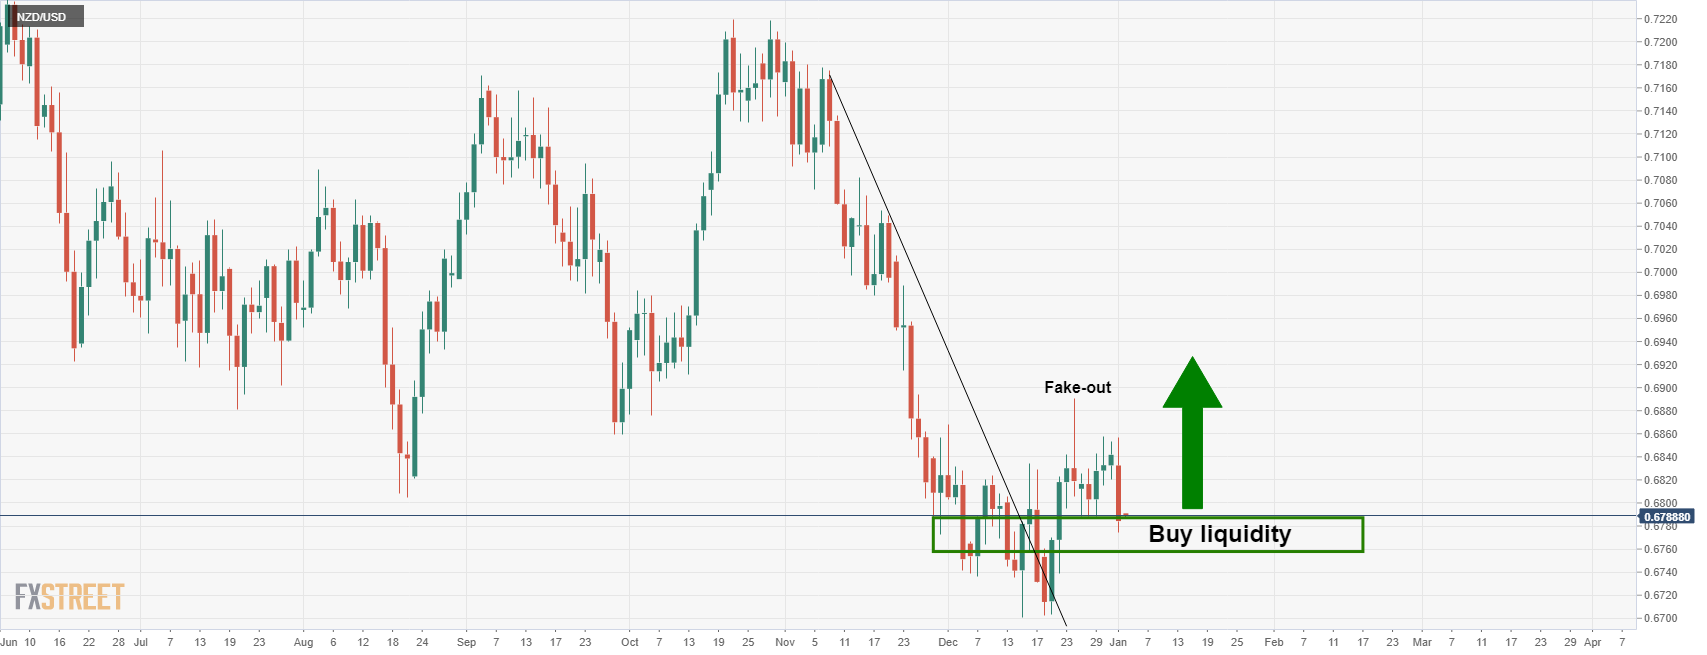
The daily chart is a complex mix of choppy price action that could instead be thought of as accumulation. Buyers are building a portfolio of a position averaging out at the cheapest price possible.
However, given the strength of the recent sell-off, there is every possibility of a continuation of the downside still:
Market Focus
 Material posted here is solely for information purposes and reliance on this may lead to losses. Past performances are not a reliable indicator of future results. Please read our full disclaimer
Open Demo Account & Personal Page