- USD/CAD Price Analysis: Bears in charge, hourly support at 1.27 the figure needs to give
Market news
USD/CAD Price Analysis: Bears in charge, hourly support at 1.27 the figure needs to give
- Bearish structures are formed across the time frames for USD/CAD.
- USD/CAD bears looking for a restest of the weekly trendline support.
USD/CAD is a complex technical structure across the time frames and the following top-down analysis illustrates the prospects of a downside extension across the weekly, daily, 4-hour and hourly charts:
USD/CAD weekly chart
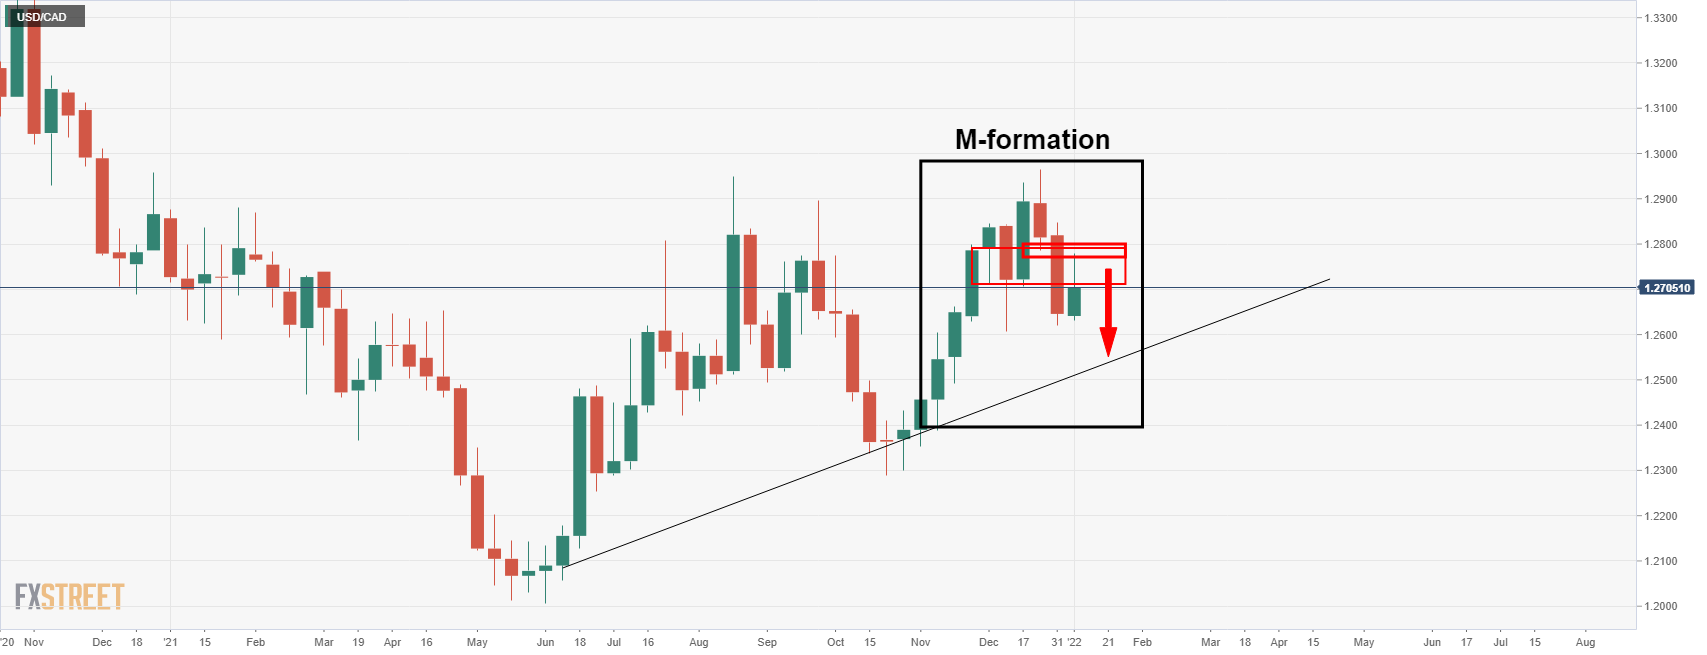
From a weekly perspective, we can see that the price has been attempting to retest the neckline of the M-formation but has so far struggled to bypass the offers which are leaving a bearish outlook for the lower time frames.
USD/CAD daily chart
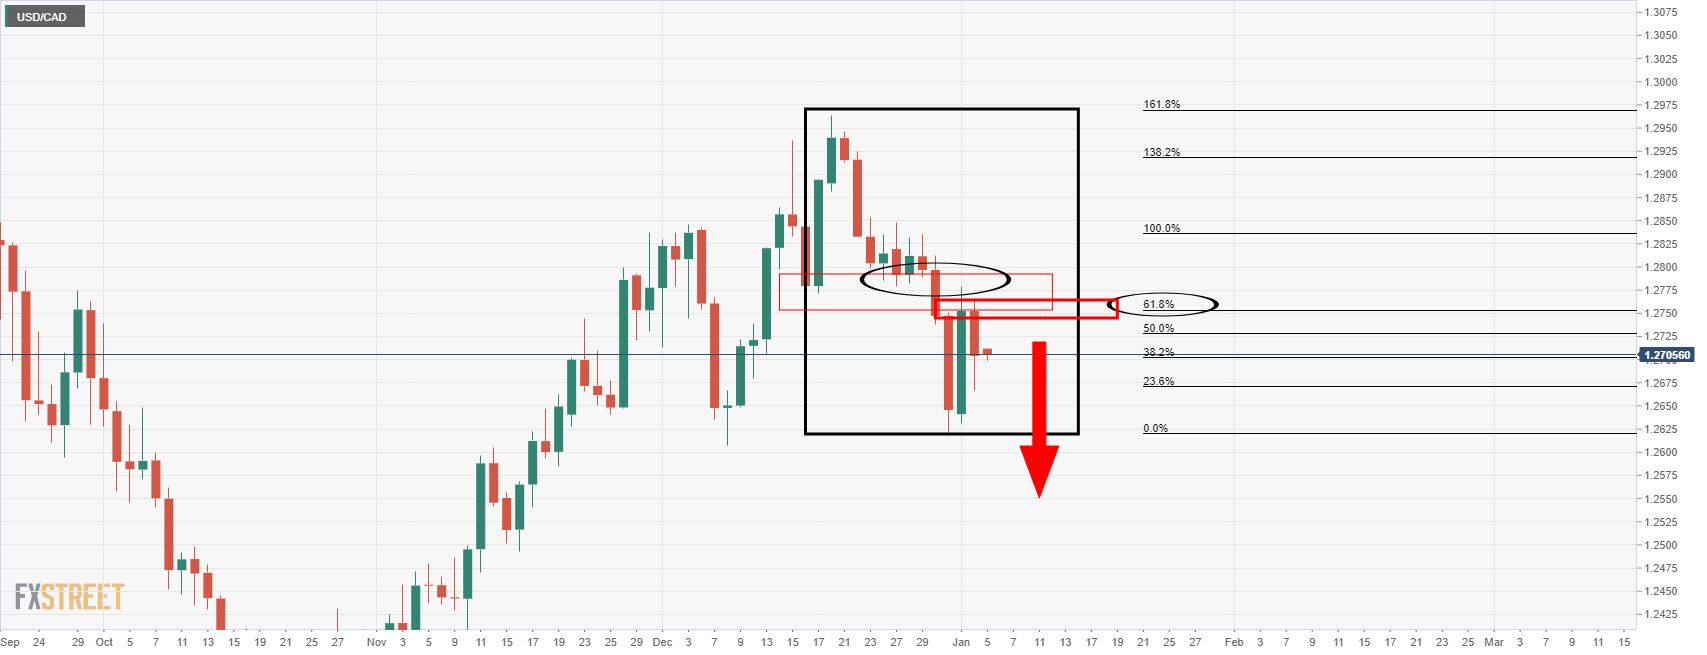
On the daily chart, we can see a similar scenario. It might be too premature to expect an immediate downside extension. However, there has been a significant restest of the bearish structure so further bullish attempts would be expected to be met with supply.
USD/CAD H4 chart
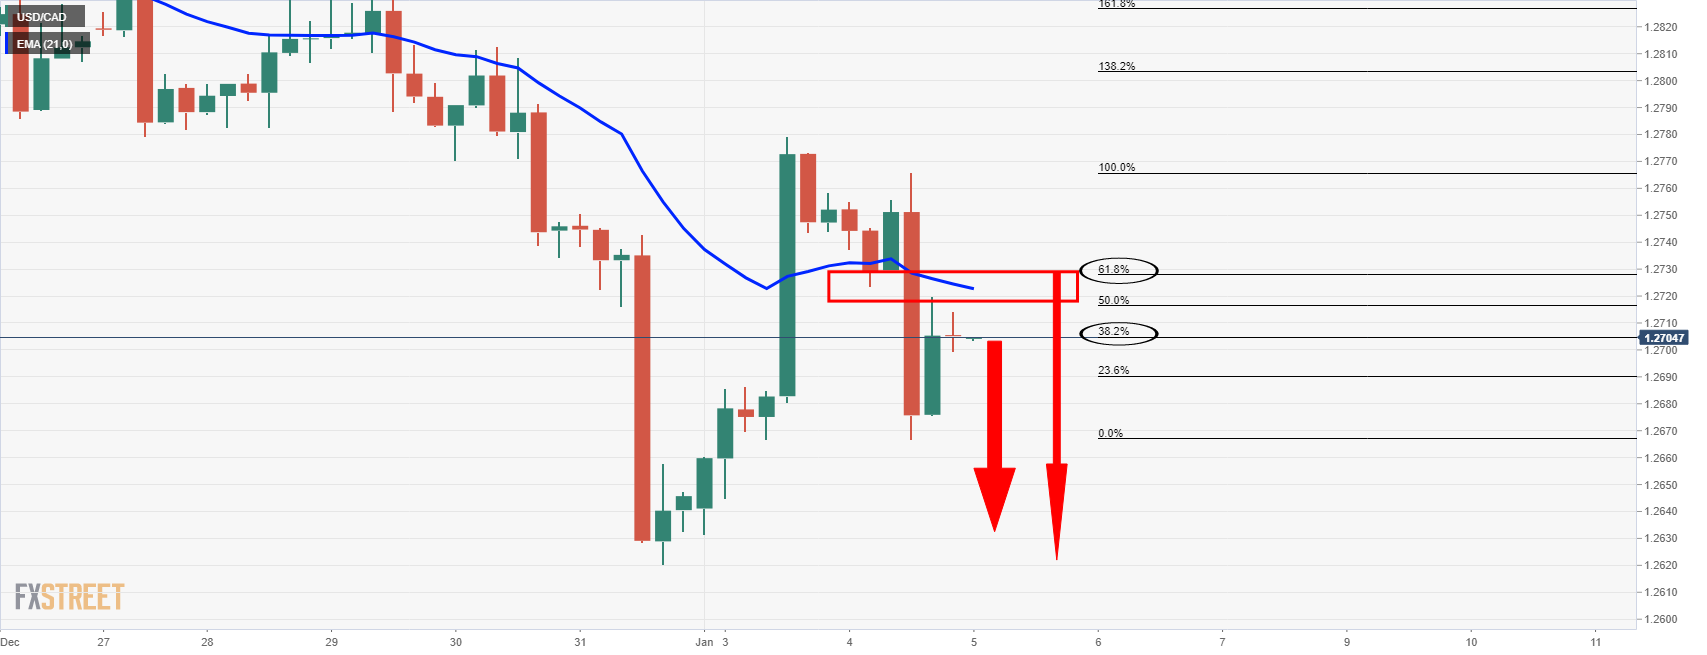
As for the 4-hour chart, there is room for a deeper correction into the 21-EMA and the 61.8% Fibo towards 1.2730 having already corrected to the 38.2% ratio. With that being said, the price seems to be climaxing around this level, 1.2705. If the bears press here, then it could be all downhill from here on.
USD/CAD H1 chart
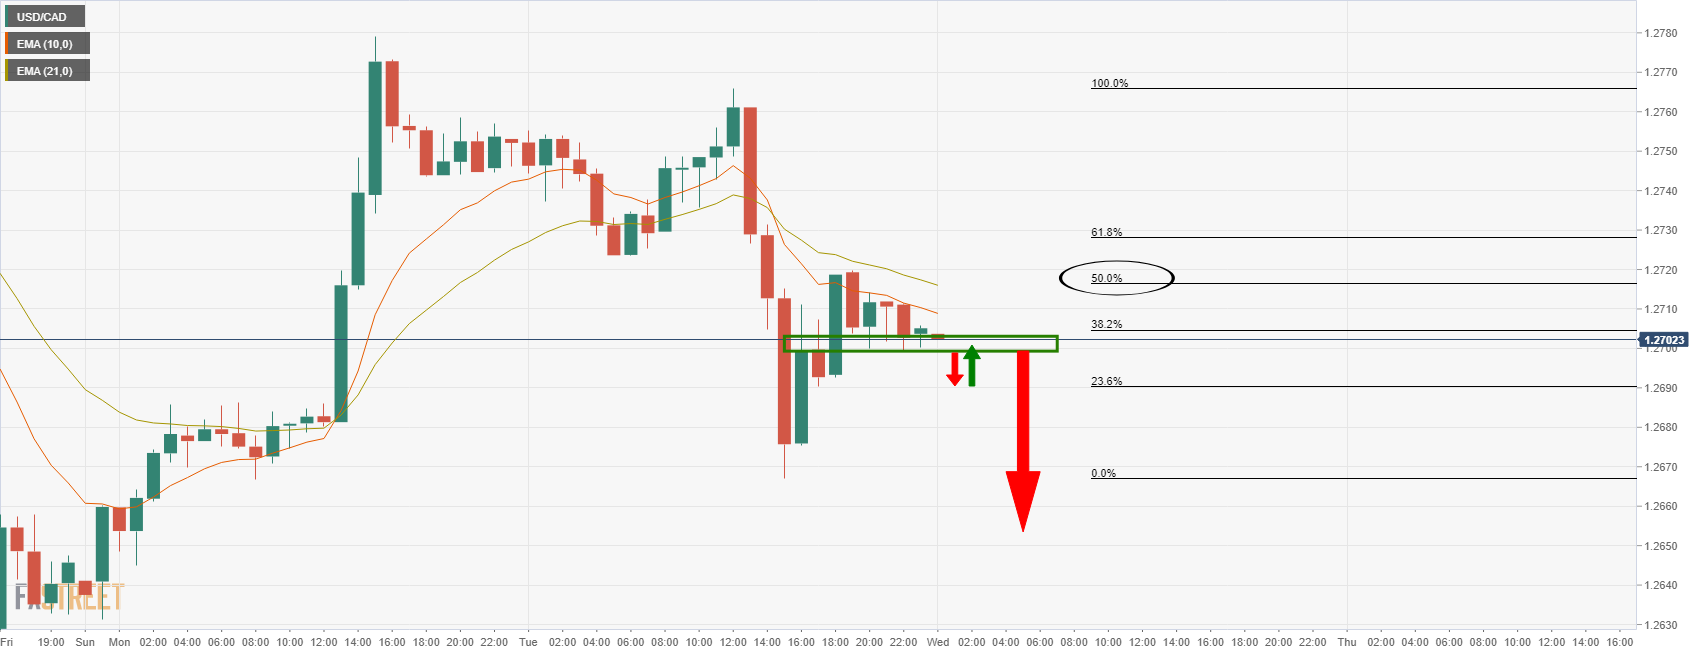
Meanwhile, on the hourly chart, this area represents support. A break at this juncture will rhyme with the above scenarios for a downside run in a bearish hourly extension beyond the hourly lows of 1.2667.
 Material posted here is solely for information purposes and reliance on this may lead to losses. Past performances are not a reliable indicator of future results. Please read our full disclaimer