- US Dollar Index Price Analysis: Bears need validation from 95.50
Market news
US Dollar Index Price Analysis: Bears need validation from 95.50
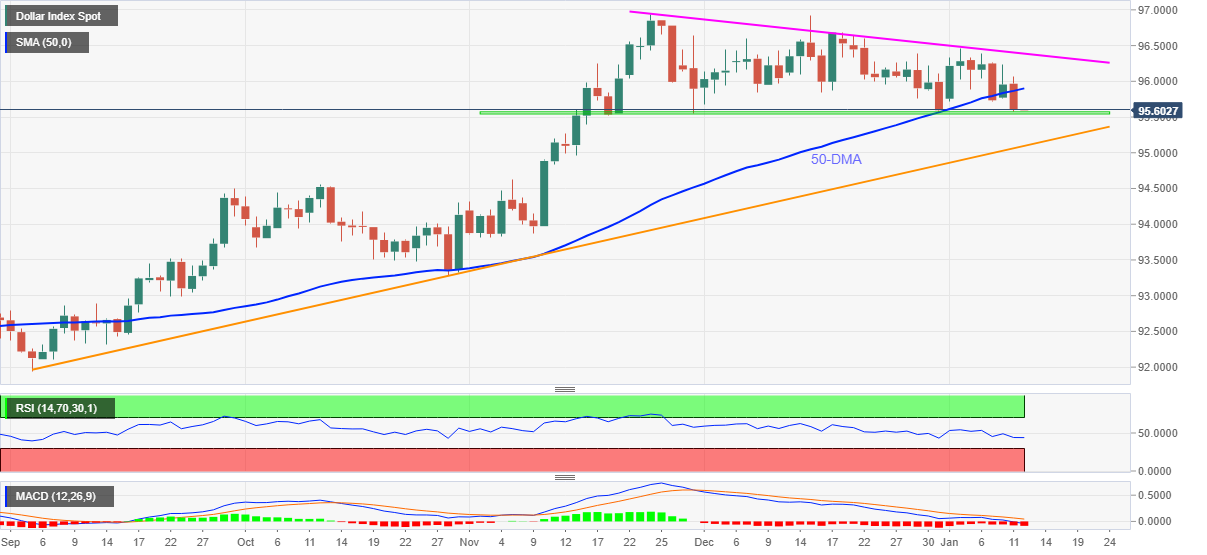
- DXY remains pressured around monthly low, battles two-month-old horizontal support.
- Clear break of 50-DMA, downbeat oscillators favor sellers.
- Ascending trend line from September acts as additional support, bulls need to cross seven-week-long resistance to retake controls.
US Dollar Index (DXY) stays depressed near 95.60, the lowest level since December 31, during Wednesday’s Asian session.
The greenback gauge provided a clear downside break of the 50-DMA to refresh the monthly low the previous day. The bearish bias also takes clues from MACD and RSI indicators.
However, a two-month-old horizontal support zone near 95.60-50 becomes a crucial challenge for the DXY pessimists.
Should the quote drop below 95.50, the odds of its plunge to a 3.5-month-old support line near the 95.00 threshold can’t be ruled out. Following that, October’s high near 94.55 will be in focus.
Meanwhile, the 50-DMA level of 95.90 and the 96.00 round figure restricts the short-term US Dollar Index upside ahead of a descending resistance line from November 24, around 96.40.
In a case where DXY rises past 96.40, the bulls can quickly cross November’s peak of 96.94 to poke the 97.00 psychological magnet.
DXY: Daily chart
Trend: Further weakness expected
 Material posted here is solely for information purposes and reliance on this may lead to losses. Past performances are not a reliable indicator of future results. Please read our full disclaimer