- USD/CAD Price Analysis: 200-DMA tests bears at two-month low
Market news
USD/CAD Price Analysis: 200-DMA tests bears at two-month low
- USD/CAD seesaws around multi-day low, pauses two-day downtrend.
- Bearish MACD signals, 100-DMA break favor sellers to aim for ascending support line from June.
- 38.2% Fibonacci retracement level guards immediate upside, monthly peak acts as additional resistance.
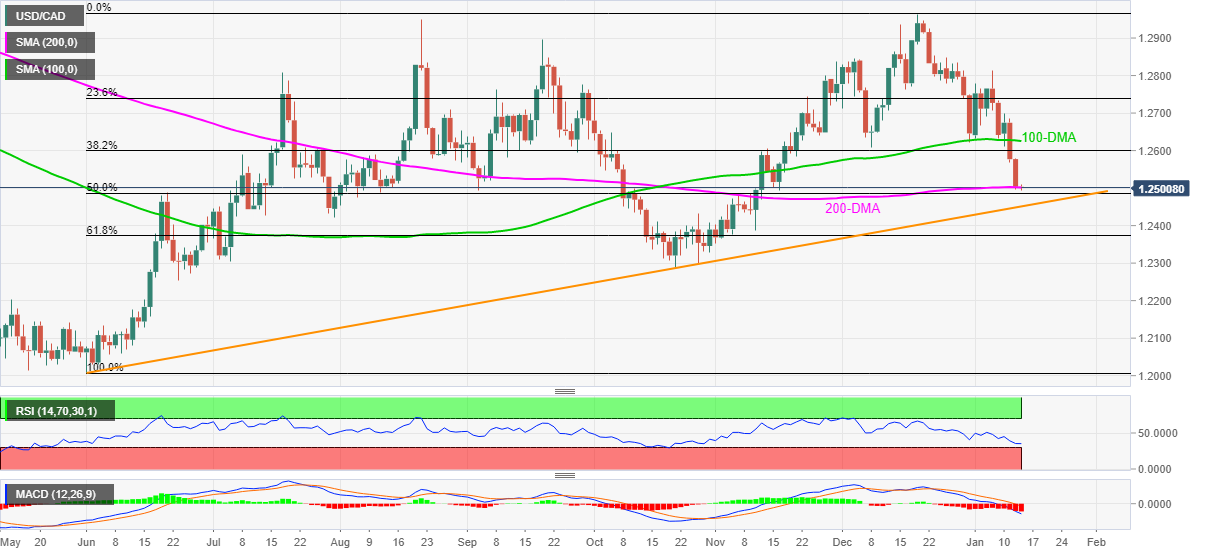
USD/CAD dribbles around 1.2500 ahead of Thursday’s European session, following a two-day south-run to poke the lowest levels since mid-November. In doing so, the Loonie pair clings to the 200-DMA by the press time
It’s worth noting that a clear downside break of the 100-DMA and bearish MACD joins downbeat RSI, not oversold, to keep USD/CAD sellers hopeful of extending the latest weakness.
As a result, the 50% Fibonacci retracement level of June-December 2021 upside, around 1.2485 and a 7.5-month-old support line near 1.2450 are nearby targets for the pair sellers.
However, the pair’s sustained weakness past 1.2450 will aim for the 61.8% Fibo. level and October’s low, respectively around 1.2375 and 1.2290.
On the flip side, the 38.2% Fibonacci retracement level of 1.2600 restricts the short-term rebound of the USD/CAD prices ahead of highlighting the 100-DMA, surrounding 1.2625 at the latest.
Furthermore, the quote’s rise past 1.2625 enables the bulls to aim for the monthly top close to 1.2815.
Overall, USD/CAD has further downside scope but the RSI line approaches the oversold territory and may restrict the quote’s declines around the key support line.
USD/CAD: Daily chart
Trend: Further weakness expected
 Material posted here is solely for information purposes and reliance on this may lead to losses. Past performances are not a reliable indicator of future results. Please read our full disclaimer