- GBP/USD Price Analysis: Further downside hinges on 1.3655 break
Market news
GBP/USD Price Analysis: Further downside hinges on 1.3655 break
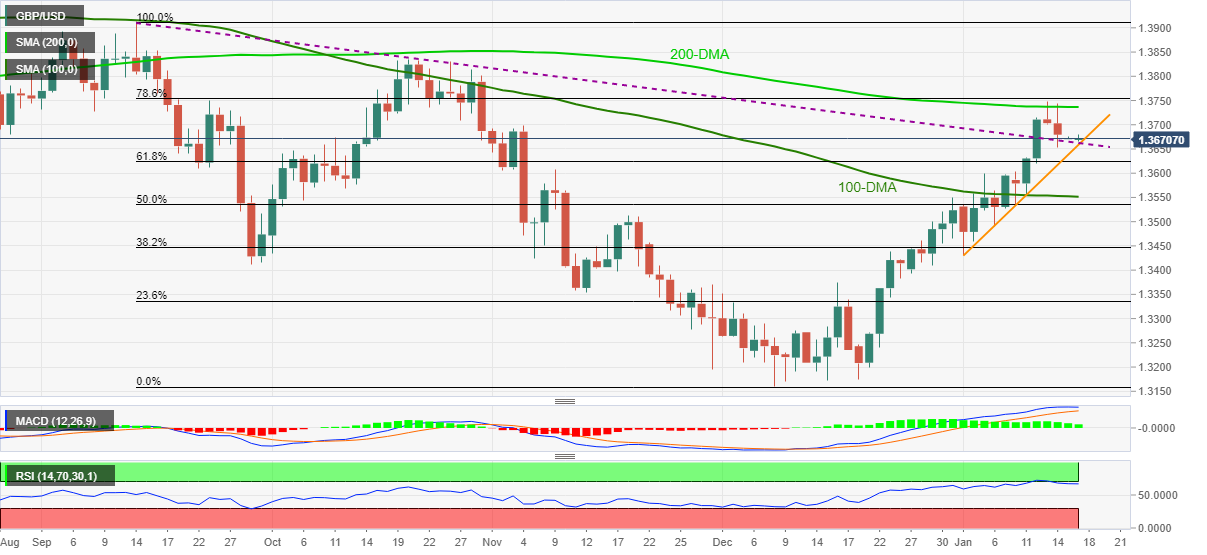
- GBP/USD remains depressed, keeps last week’s pullback from 200-DMA.
- Receding bullish bias of MACD, nearly overbought RSI signal further weakness.
- Previous resistance line from September, two-week-old support line limit immediate downside.
- 78.6% Fibonacci retracement level, 100-DMA act as additional trading filters.
GBP/USD bounces off intraday low to 1.3675 during Monday’s Asian session. Even so, the cable pair holds onto the previous week’s U-turn from the 200-DMA.
In addition to the failures to cross the key moving average, easing bullish bias of the MACD and the overbought RSI conditions also hint at the GBP/USD pair’s further declines.
However, a convergence of a four-month-old previous resistance line and an upward sloping trend line from January 03, around 1.3655, becomes the key short-term support.
Also likely to challenge the GBP/USD bears is the 61.8% Fibonacci retracement (Fibo.) of the September-December downturn, near 1.3620, as well as the 100-DMA level of 1.3550.
Meanwhile, recovery moves may attempt to cross the 200-DMA level of 1.3735 whereas the 78.6% Fibo. level surrounding 1.3755 acts as an additional filter to the north.
Should GBP/USD bulls manage to cross the 1.3755 hurdle, tops marked in October and September 2021, respectively around 1.3835 and 1.3915, will be in focus.
GBP/USD: Daily chart
Trend: Further weakness expected
 Material posted here is solely for information purposes and reliance on this may lead to losses. Past performances are not a reliable indicator of future results. Please read our full disclaimer