- USD/JPY Price Analysis: Bulls cross 200-SMA but 115.10 appears tough nut to crack
Market news
USD/JPY Price Analysis: Bulls cross 200-SMA but 115.10 appears tough nut to crack
- USD/JPY grinds higher around intraday top, extends previous day’s bounce off monthly low.
- Bullish MACD signals, upside break of the key moving average favor buyers.
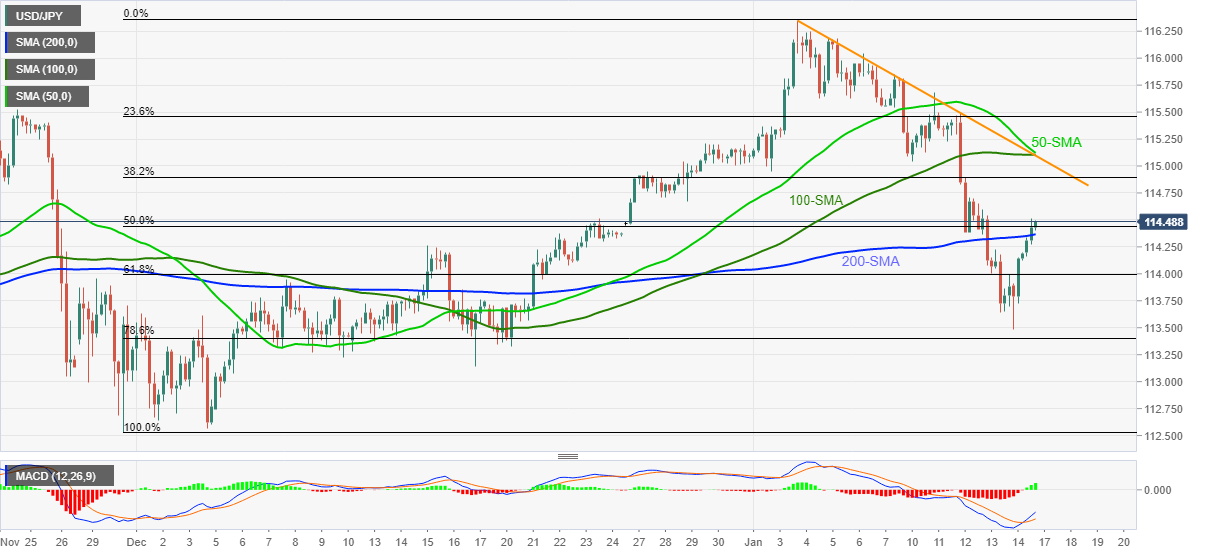
- Convergence of 100-SMA, 50-SMA and fortnight-old descending trend line challenge bulls.
USD/JPY stays firmer around 114.50, up 0.26% intraday heading into Monday’s European session.
In doing so, the yen pair extends the previous day’s rebound from a multi-day low to cross the 200-DMA, around 114.35 at the latest.
A clear upside break of 114.35 joins bullish MACD signals to keep buyers hopeful to aim for the 115.00 threshold, also comprising 38.2% Fibonacci retracement (Fibo.) of November 30, 2021, to January 04, 2022 upside.
However, the confluence of the 50-SMA, a fortnight-long resistance line and 100-SMA becomes a crucial hurdle around 115.10 for the USD/JPY bulls to cross afterward.
Meanwhile, 61.8% and 78.6% Fibo. levels, respectively around 114.00 and 113.40, will restrict the quote’s short-term declines before directing USD/JPY sellers towards the late 2021 bottom surrounding 112.50.
Overall, USD/JPY prices are likely to remain firmer but the 115.10 level will be a test for the pair bulls.
USD/JPY: Four-hour chart
Trend: Further upside expected
 Material posted here is solely for information purposes and reliance on this may lead to losses. Past performances are not a reliable indicator of future results. Please read our full disclaimer