- USD/TRY Price Analysis: Lira buyers stay hopeful near $13.45 inside fortnight-old ascending triangle
Market news
USD/TRY Price Analysis: Lira buyers stay hopeful near $13.45 inside fortnight-old ascending triangle
- USD/TRY seesaws after two-day downtrend inside bearish chart pattern
- Sustained trading below 200-SMA, steady RSI favor pair sellers.
- 38.2% Fibonacci retracement level, triangle’s support line limit short-term downside.
USD/TRY licks its wounds near $13.45, up 0.06% intraday after two consecutive days of downside to Tuesday’s Asian session.
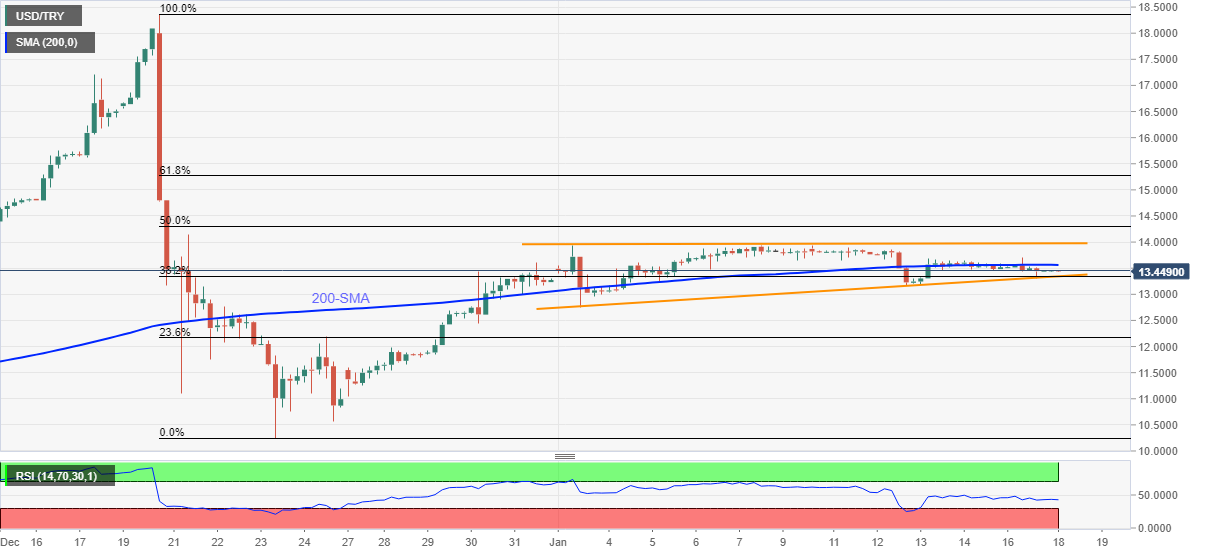
Even so, the Turkish lira (TRY) pair remains below the 200-SMA, as well as inside a two-week-long ascending triangle bearish chart pattern.
Given the steady RSI line, the gradual easing of the USD/TRY prices seems to be on the table.
However, a clear downside break of the $13.35 becomes necessary as the level comprises the lower of the stated triangle and 38.2% Fibonacci retracement of the December 20-23 downside.
Following that, a downside towards 23.6% Fibo. level surrounding $12.16 and then to the $12.00 threshold can’t be ruled out.
Meanwhile, recovery moves remain dismal below the 200-SMA level of $13.55, a break of which will propel the quote towards the triangle’s upper line of the bearish chart pattern near $13.95.
It’s worth observing that the $14.00 threshold will act as a validation point for the fresh rally targeting the 61.8% Fibonacci retracement level near $15.25.
USD/TRY: Four-hour chart
Trend: Further downside expected
 Material posted here is solely for information purposes and reliance on this may lead to losses. Past performances are not a reliable indicator of future results. Please read our full disclaimer