- USD/CHF Price Analysis: Retreats from 200-HMA inside weekly rising wedge
Market news
USD/CHF Price Analysis: Retreats from 200-HMA inside weekly rising wedge
- USD/CHF eases from weekly top after three-day uptrend, inside bearish chart pattern.
- 100-HMA, 23.6% Fibonacci retracement adds to the downside filters, bulls need validation from monthly peak.
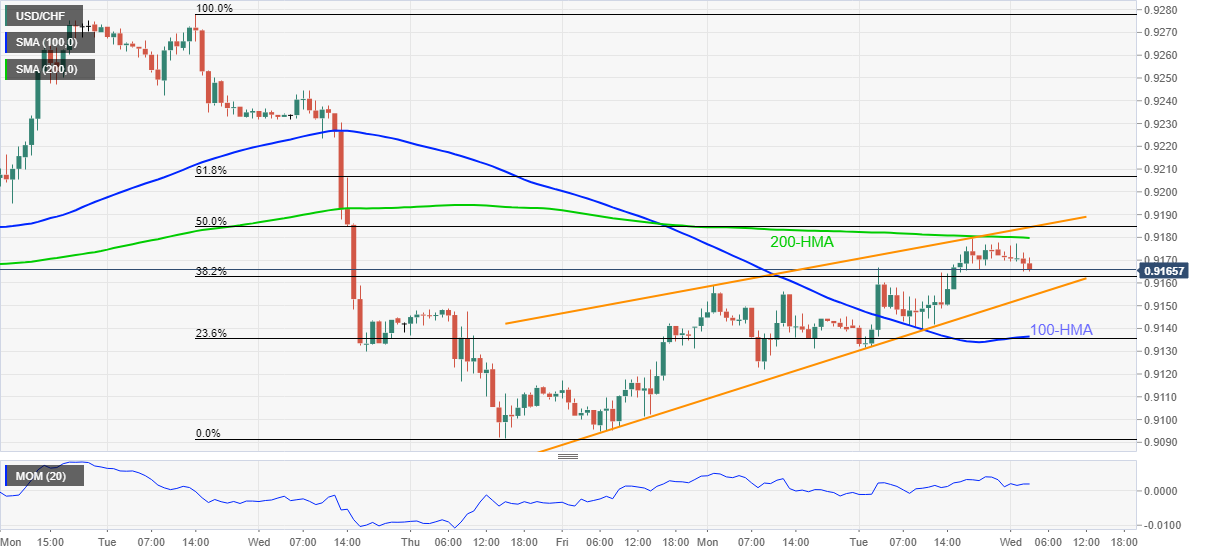
USD/CHF pauses weekly rebound, easing to 0.9167 ahead of Wednesday’s European session. In doing so, the Swiss currency (CHF) pair steps back from the 200-HMA inside a short-term rising wedge bearish chart pattern.
Given the pair’s failure to cross the key HMA, coupled with the firmer Momentum and bearish chart pattern, its further declines are likely on the table.
However, a clear downside break of the stated wedge’s support line, near 0.9155, becomes necessary for the USD/CHF sellers to aim for the theoretical target of 0.9070.
Though, a convergence of the 100-HMA and 23.6% Fibonacci retracement (Fibo.) level of January 11-13 downside, near 0.9135, becomes a crucial intermediate halt to test bears.
Meanwhile, the 200-HMA and upper line of the stated wedge, respectively around 0.9180 and 0.9185, guard the quote’s short-term rebound.
Following that, the 61.8% Fibo. level and the monthly high, close to 0.9205 and 0.9280 in that order, will be in focus.
USD/CHF: Hourly chart
Trend: Pullback expected
 Material posted here is solely for information purposes and reliance on this may lead to losses. Past performances are not a reliable indicator of future results. Please read our full disclaimer