- GBP/USD Price Analysis: Further downside hinges on bear flag, 1.3610 in focus
Market news
GBP/USD Price Analysis: Further downside hinges on bear flag, 1.3610 in focus
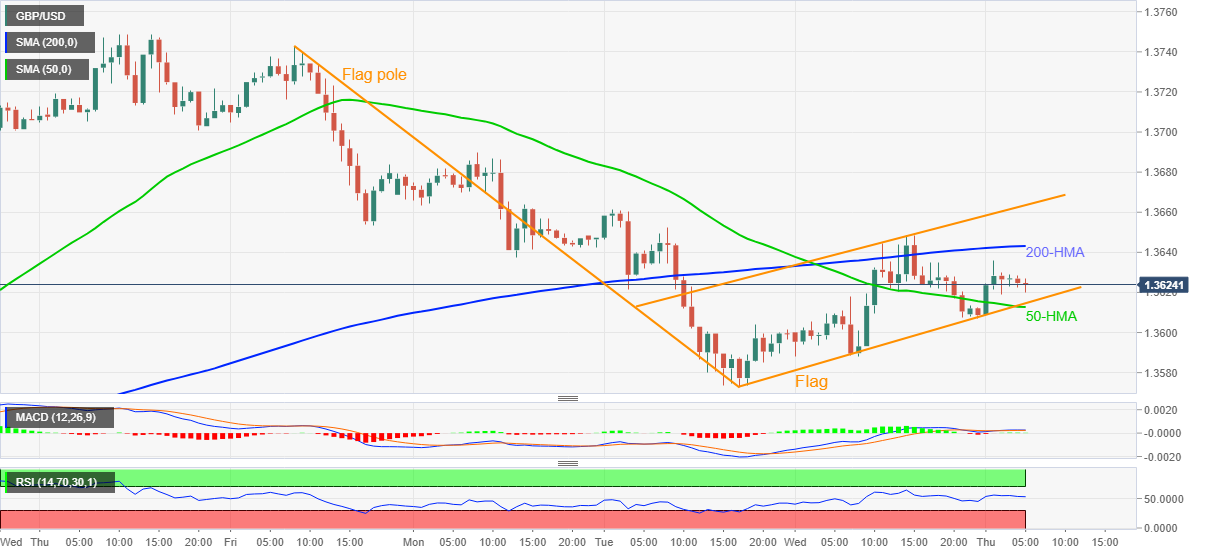
- GBP/USD prints bearish chart pattern on hourly play, confirmation awaited.
- Sustained trading below 200-HMA keeps sellers hopeful amid steady RSI.
- 50-HMA adds strength to the 1.3610 support, bulls need validation from 1.3665.
GBP/USD pares intraday gains inside a bearish chart pattern, around 1.3625 heading into Thursday’s London open.
The cable pair’s corrective pullback from a weekly low during the last two days prints a bear flag chart pattern on the hourly play.
Given the sluggish MACDD and steady RSI, the cable prices are likely to extend the latest weakness. Also portraying the bearish bias is the quote’s sustained trading below the 200-HMA.
However, the 50-HMA adds strength to the 1.3610 support, a break of which will confirm the bearish chart formation and direct prices towards the theoretical target of 1.3450.
During the fall, the recent swing low near 1.3570 and the mid-November peak around 1.3513 will be crucial to watch.
Alternatively, the 200-HMA level of 1.3643 guards short-term GBP/USD rebound ahead of the flag’s upper line, around 1.3665 at the latest.
Following that, a run-up towards the 1.3700 threshold and the monthly high near 1.3750 can’t be ruled out.
GBP/USD: Hourly chart
Trend: Further weakness expected
 Material posted here is solely for information purposes and reliance on this may lead to losses. Past performances are not a reliable indicator of future results. Please read our full disclaimer