- GBP/USD Price Analysis: Bulls packing a punch through 1.35 the figure, 1.3580 eyed
Market news
GBP/USD Price Analysis: Bulls packing a punch through 1.35 the figure, 1.3580 eyed
- GBP/USD bulls look to 1.3580s for the days ahead.
- Near-term bears are in anticipaiton of a deeper correction on the lower time frames.
In ealrier analysis in the US sesison, 1.35 the figure was noted as an anchor point from which bulls would be expected to struggle to pull away from. However, a key level of resistance was penertrated and a high high for the day was scoed all of the way towards 1.3520:
GBP/USD, prior analysis
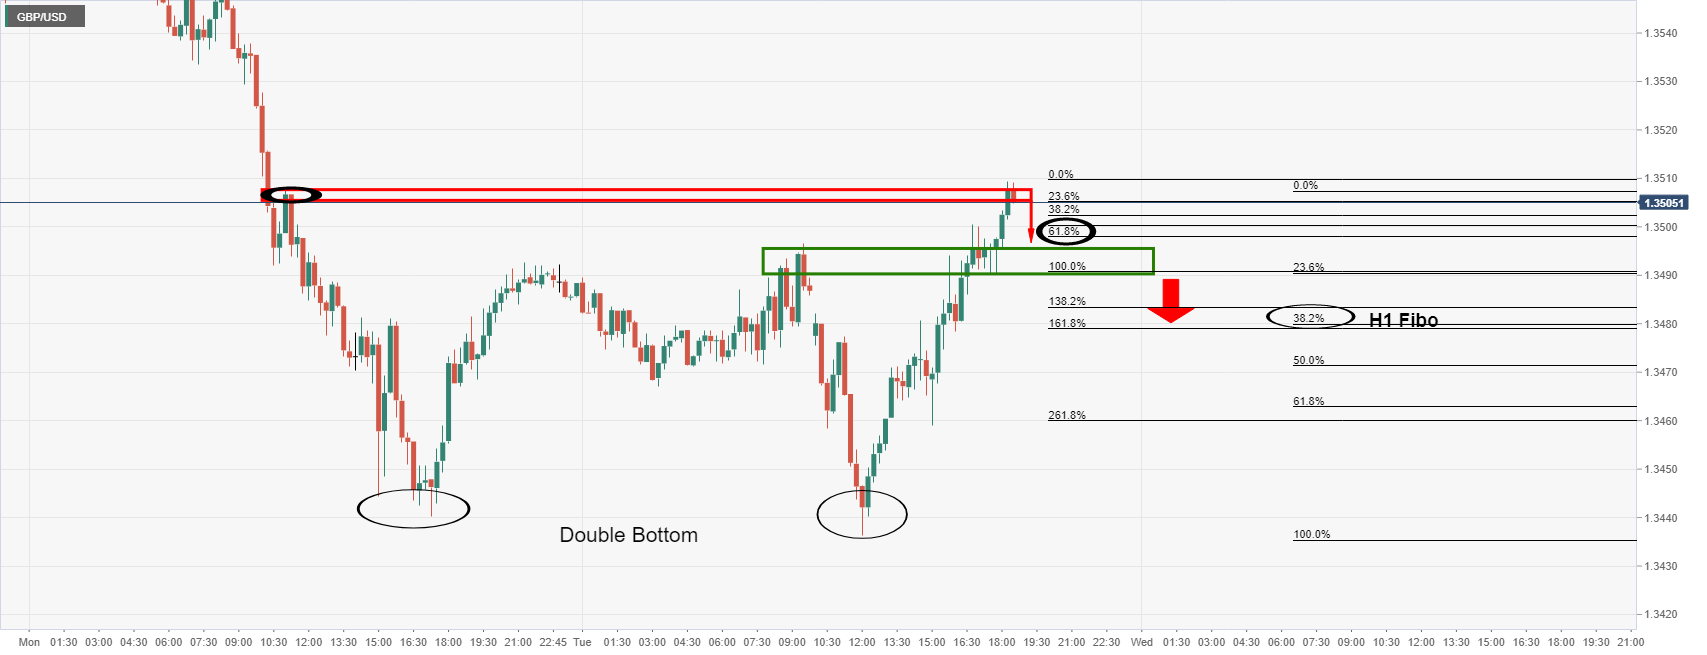
The price had run into a wall of resistance as per the prior analysis on the 15-min chart above. A rejection in the first test there was expected to open risk back to the 61.8% Fibo of the 15-min bullish impulse near 1.35 the figure.
However, the bulls have taken the reigns and pushed on through as follows:
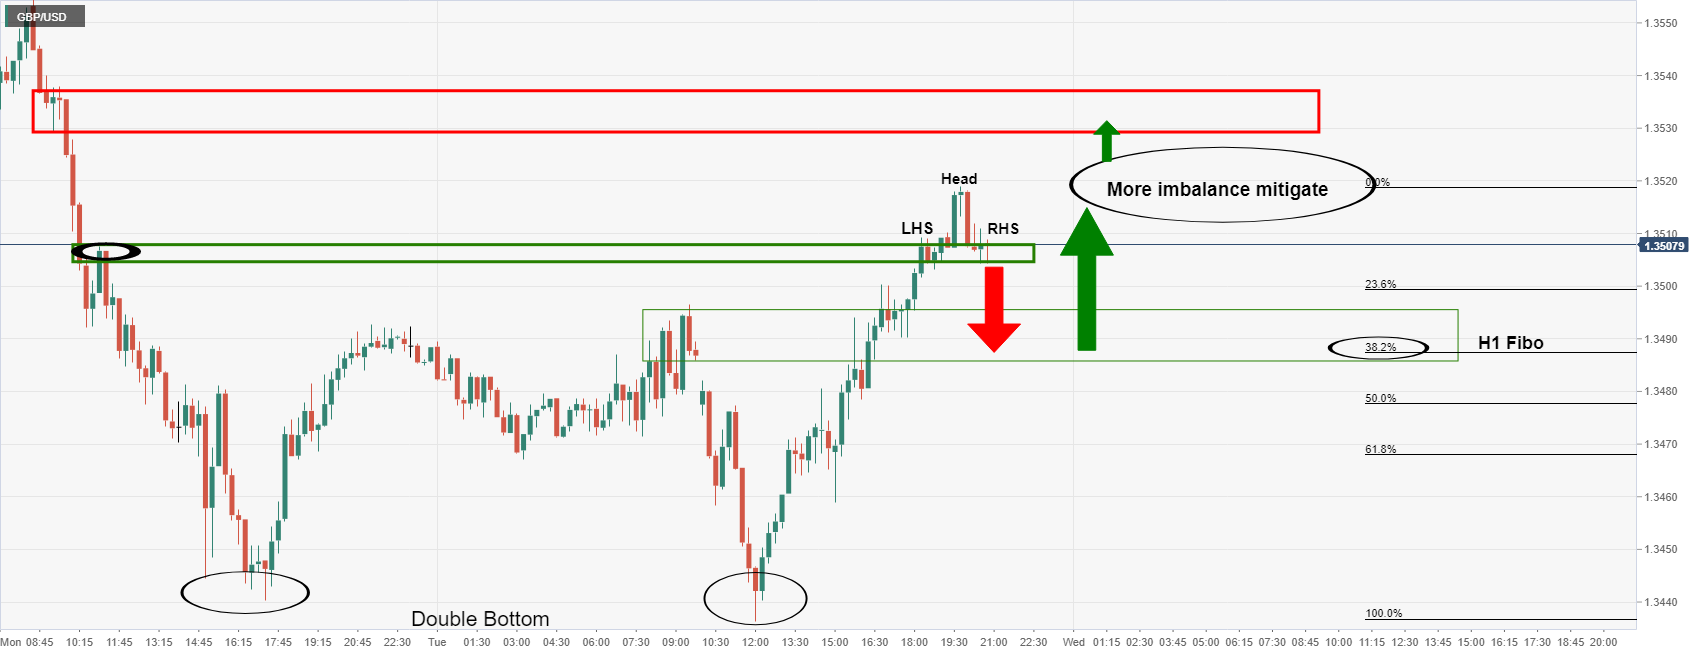
The price rallied to a high of 1.3518 and is about to leave a bullish daily closing candle for the day which opens prospects of a deeper retracement of the bearish daily impulse as per the chart below. In the mean time however, there is now bearish structure forming on the 15-min chart in the form of a potential bearish head and shoulders topping formaiton.
If trhe right hand shoulder forms followed by a subsequent break and close below the neckline near 1.35 the fifure, then the hourly 38.2% % Fibonacci retracement will be eyed for a potential support for the sessions ahead. Should the dollar remain under pressure, then the bulls will be encouraged to renegage at a discount and that could lead to a bullish exptensio into the imbalance of price between the highs and the late 1.3530s.
GBP/USD daily chart
Looking further a field, the daily M-formaiton is compelling, especially given the prospects of today's bullish daily close:
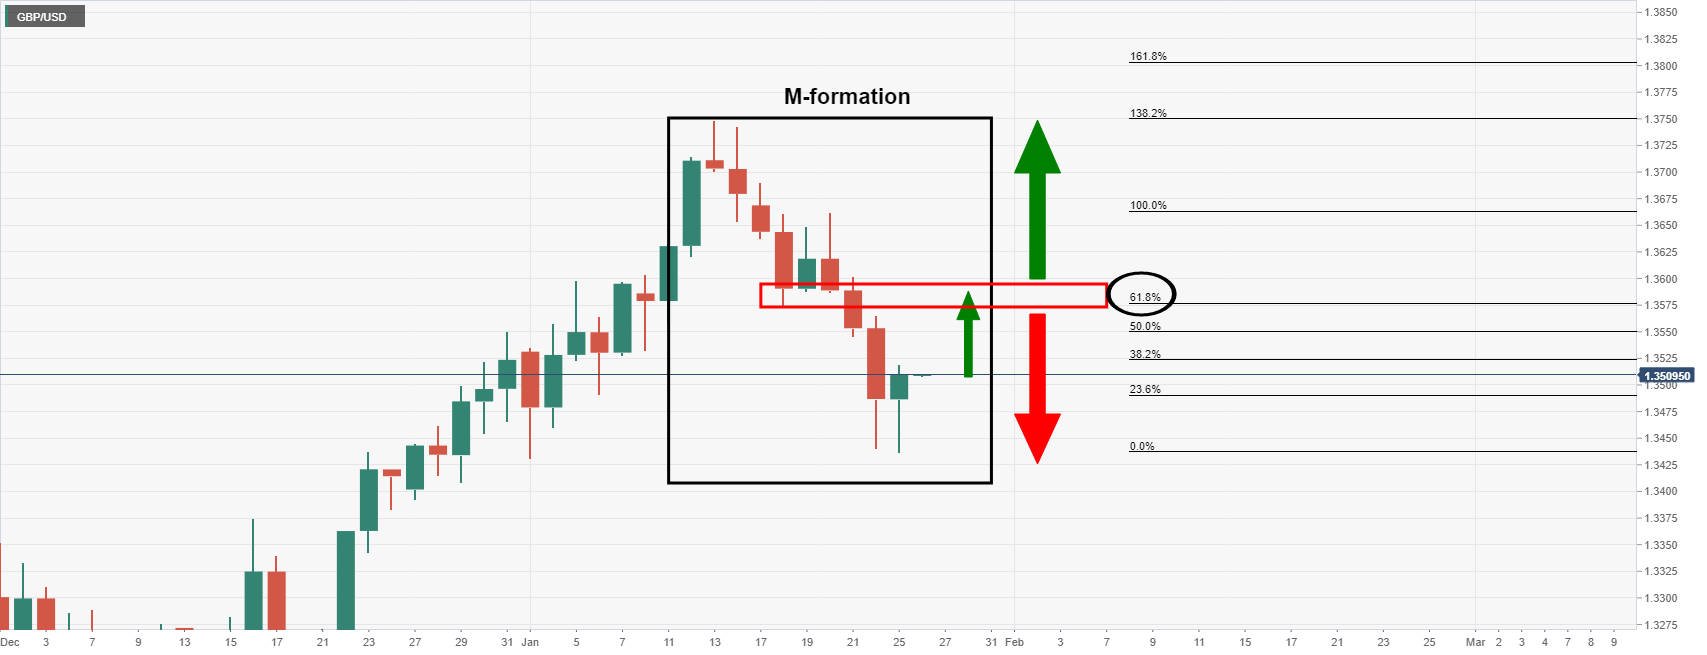
The 61.8% Fibonacci retracement level has a cnfluence with the neckline of the M-formaiton. The W and M patterns have a high completion rate of the price being drawn back into the prior structure, aka, the neckline. In this case, near to 1.3580.
 Material posted here is solely for information purposes and reliance on this may lead to losses. Past performances are not a reliable indicator of future results. Please read our full disclaimer