- Gold Price Forecast: XAU/USD skates on thin ice around $1,800 ahead of key events – Confluence Detector
Market news
Gold Price Forecast: XAU/USD skates on thin ice around $1,800 ahead of key events – Confluence Detector
- Gold price wavers in a familiar range, but the downside appears favored.
- The USD correction is saving the day for gold bulls ahead of key event risks.
- Gold’s path of least resistance appears down, US jobs data eyed.
Gold price has stalled its two-day relief recovery, as sellers are back in the game amid a risk-on rally on global stocks. Traders have looked past the Fed angst, as upbeat corporate earnings lift the mood. The risk-on flows-driven US dollar demise and retreating Treasury yields are helping put a floor under the gold price. Incoming event risks in the US employment data, BOE and ECB rate decisions, however, will provide a fresh direction in gold price.
Read: Gold back to inflection point
Gold Price: Key levels to watch
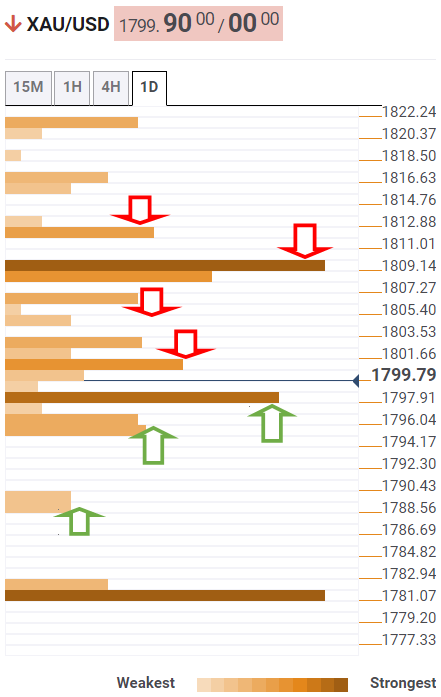
The Technical Confluences Detector shows that the gold price is challenging the Fibonacci 61.8% level of the daily range at $1,802 on renewed upside. That is the point where the SMA-50 one-day also hangs around.
If that level is cleared decisively, then bulls will look out for a confluence of the 200-day SMA and Fibonacci 23.6% level of the daily range at $1,806.
The next powerful resistance aligns at $1,809, the intersection of the previous day’s high and Fibonacci 38.2% of the weekly and monthly ranges.
Further up, the 200-4hr SMA at $1,812 will be the level to beat for gold bulls.
On the flip side, the immediate downside cushion is seen at Fibonacci 23.6% of the weekly and monthly ranges at $1,797.
Sellers will then target $1,795, where the 100-day SMA and the previous day’s low meet.
A sharp drop towards $1,789 cannot be ruled out on a breach of the latter. That level is the convergence of the Fibonacci 161.8% of the daily range and daily S2 pivot point.
Here is how it looks on the tool
About Technical Confluences Detector
The TCD (Technical Confluences Detector) is a tool to locate and point out those price levels where there is a congestion of indicators, moving averages, Fibonacci levels, Pivot Points, etc. If you are a short-term trader, you will find entry points for counter-trend strategies and hunt a few points at a time. If you are a medium-to-long-term trader, this tool will allow you to know in advance the price levels where a medium-to-long-term trend may stop and rest, where to unwind positions, or where to increase your position size.
 Material posted here is solely for information purposes and reliance on this may lead to losses. Past performances are not a reliable indicator of future results. Please read our full disclaimer