- Gold Price Forecast: XAU/USD remains ‘buy-the-dip’ while above $1,815 – Confluence Detector
Market news
Gold Price Forecast: XAU/USD remains ‘buy-the-dip’ while above $1,815 – Confluence Detector
- Gold price licks its wounds, in the aftermath of hotter US inflation.
- US yields stabilize at higher levels, as DXY rockets on more Fed rate hike bets.
- Gold price suffers from US inflation-led blow, downside appears limited.
The US Federal Reserve (Fed) is now expected to hike rates by 50-basis points (bps) in March while delivering over four rate increases this year, as the inflation rate hit fresh 40-year highs at 7.5% YoY. Heightening expectations of hefty and faster Fed lift-offs could keep gold price undermined. However, a pause in the US Treasury yields rally may offer support to gold bulls. Further, a bunch of healthy support levels on gold’s technical graphs could also help cushion the downside.
Read: US yields jump after inflation soars to its biggest rise in forty years
Gold Price: Key levels to watch
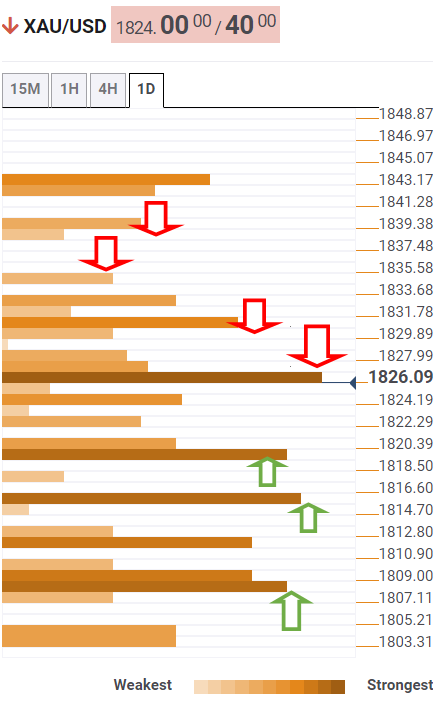
The Technical Confluences Detector shows that the gold price is holding above the previous day’s low of $1,822.
The next critical support is envisioned at $1,819, which is the convergence of the SMA100 four-hour, pivot point one-week R1 and pivot point one-day S1.
A breach of the latter will expose the downside towards $1,815, where the previous week’s low, SMA200 four-hour and SMA50 four-hour meet.
The last line of defense for gold bulls is aligned at $1,809, the confluence of the SMA50 one-day, Fibonacci 38.2% one-month and Fibonacci 23.6% one-week.
On the upside, acceptance above the Fibonacci 61.8% one-month at $1,826 is critical to initiating a meaningful recovery towards $1,831 – the SMA5 four-hour.
Further up, the Fibonacci 61.8% one-day at $1,835 will challenge the bearish commitments. The next stop for bulls is seen at the pivot point one-day R1 at $1,839.
Here is how it looks on the tool
About Technical Confluences Detector
The TCD (Technical Confluences Detector) is a tool to locate and point out those price levels where there is a congestion of indicators, moving averages, Fibonacci levels, Pivot Points, etc. If you are a short-term trader, you will find entry points for counter-trend strategies and hunt a few points at a time. If you are a medium-to-long-term trader, this tool will allow you to know in advance the price levels where a medium-to-long-term trend may stop and rest, where to unwind positions, or where to increase your position size.