- EUR/USD Price Analysis: Bullish accumulaiton under way, eye son weekly M-formaiton
Market news
11 April 2022
EUR/USD Price Analysis: Bullish accumulaiton under way, eye son weekly M-formaiton
- EUR/USD bulls are moving in and eye the weekly M-formation.
- The accumulation phase is underway on the lower time charts.
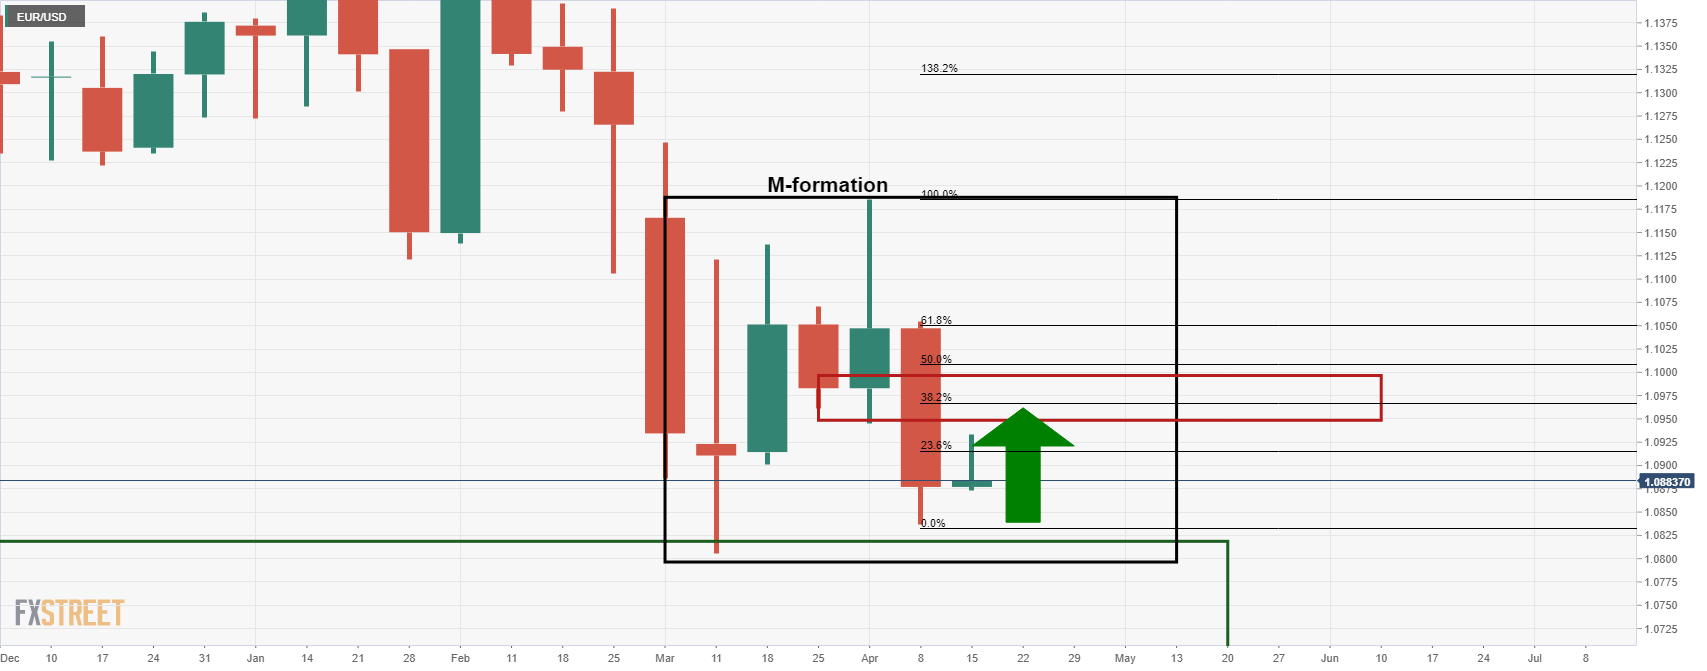
EUR/USD is accumulating at the bottom of the bearish cycle and the weekly chart has an M-formation printed which is a reversion pattern that would be expected to see the price revert to test the neckline as resistance.
EUR/USD weekly chart
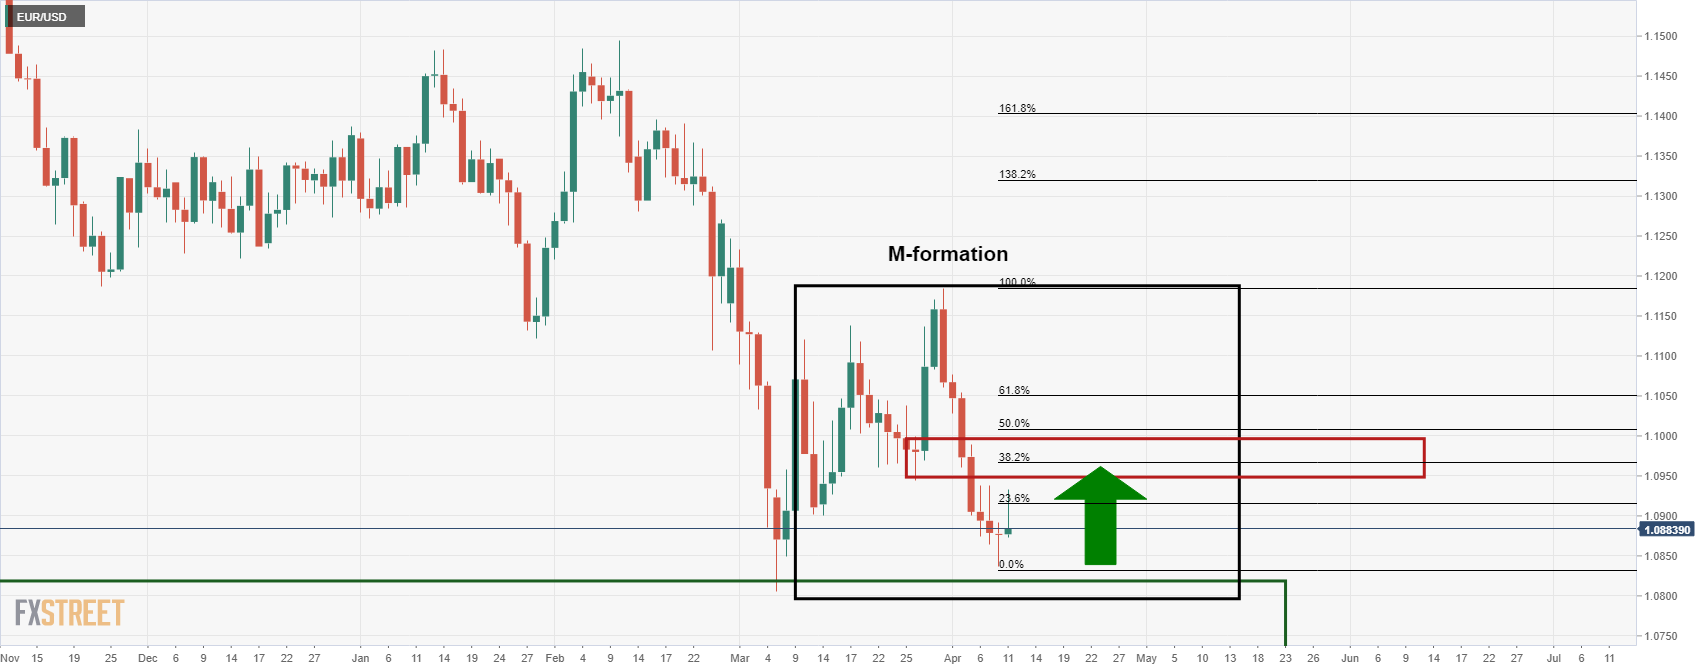
From a daily perspective, the 38.2% Fibonacci retracement level aligns with the prior support near 1.0950, an area of potential resistance:
EUR/USD daily chart
Market Focus
Open Demo Account & Personal Page