- EUR/USD Price Analysis: Bulls stepping in and eye the weekly M-formation
Market news
EUR/USD Price Analysis: Bulls stepping in and eye the weekly M-formation
- EUR/USD bears are in charge and are taking on the monthly support.
- The weekly chart, however, has left a reversion pattern, so some mitigation could be in order.
The US dollar rose this week to a fresh 20-year high against a basket of currencies but the euro has still managed to come up for air on Tuesday, trading around flat for the day at the time of writing. The high came in at 1.0814 but the price is sticking to a narrow range with the low at 1.0761.
Nevertheless, there are bullish prospects for the longer-term charts, so long as the bulls can commit at monthly support, at least for the meanwhile. The following illustrates the weekly and monthly structures that lean with a bullish bias.
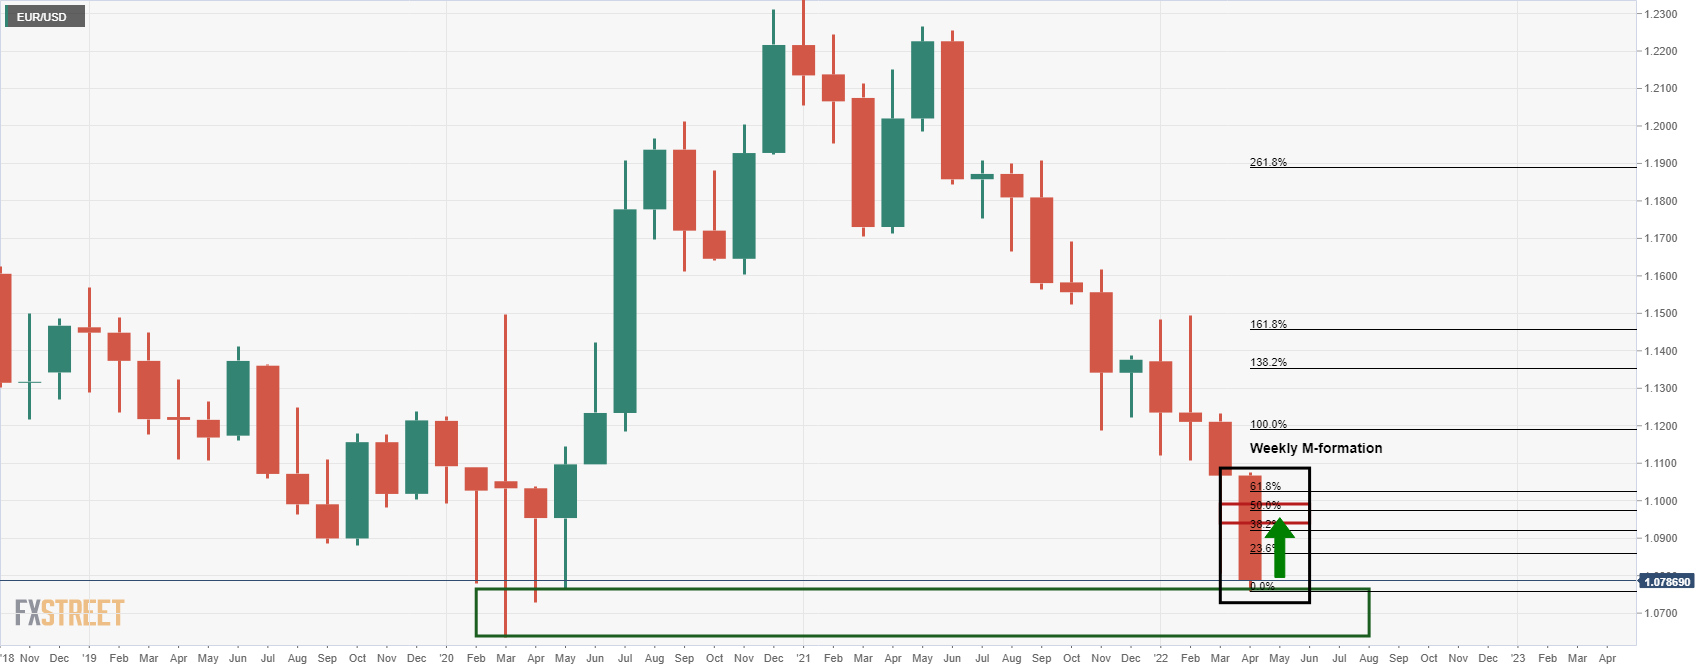
EUR/USD weekly chart
The M-formation on the weekly chart is compelling as it is a reversion pattern. The price would be expected to move in towards the neckline ner a 38.2% Fibonacci retracement level in the weeks to come.
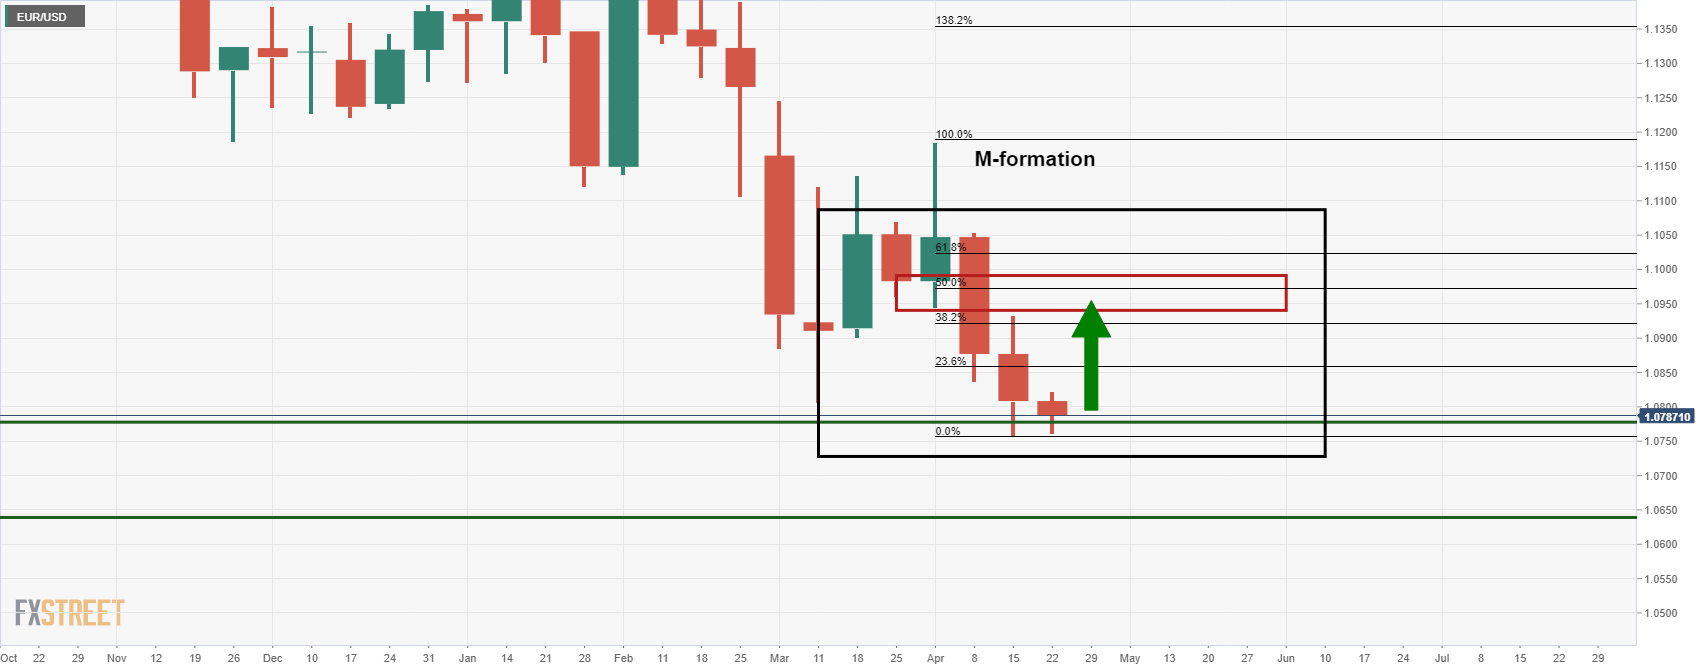
EUR/USD monthly chart
The monthly chart, on the other hand, shows that the price is meeting a demand area. There is scope for further downside to testing deeper into this area, but some meanwhile mitigation of the bearish impulse's imbalance in price could be in order first.