- Gold Price Forecast: XAUUSD sellers remain hopeful while below $1,960 – Confluence Detector
Market news
Gold Price Forecast: XAUUSD sellers remain hopeful while below $1,960 – Confluence Detector
- Gold Price sees a tepid bounce but the downside remains favored.
- Gold Price eyes $1,931, as US real yields turn positive for first time since 2020.
- $1,960 is the level to beat for XAUUSD bulls should the rebound extend.
Gold Price is licking its wounds after Tuesday’s extended correction from six-week highs of $1,998. XAUUSD seems to be benefiting from the retreat in the US dollar alongside the Treasury yields. However, the risks appear skewed to the downside for Gold Price, as the US 10-year Treasury Inflation-Protected Securities (TIPS) yields hit the highest in two years on Wednesday, extending into positive territory for the second straight day. Surging US real returns on faster Fed rate hikes expectations will continue to remain a headwind for Gold Price. Gold traders now look forward to the upcoming Fed commentary and the Beige Book for fresh trading impetus.
Also read: Gold technical picture for 2022
Gold Price: Key levels to watch
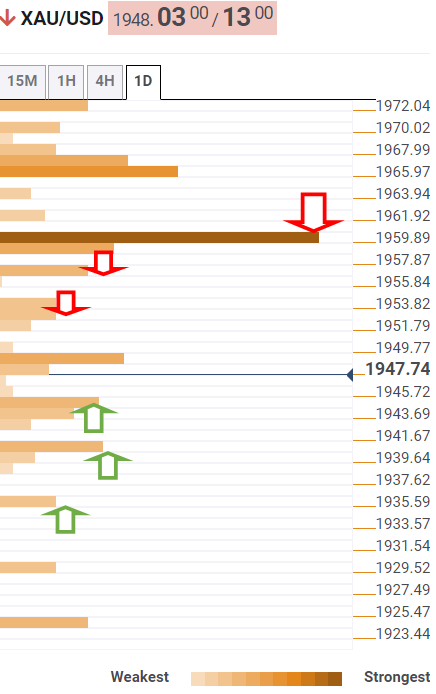
The Technical Confluences Detector shows that gold price tested the Fibonacci 23.6% one-day at $1,951 on its minor recovery mode.
The next relevant resistance is aligned at the SMA10 one-day at $1,954, above which the Fibonacci 61.8% one-week at $1,956 could come into play.
The confluence of the previous year’s high, Fibonacci 61.8% one-month and the Fibonacci 38.2% one-day at $1,960 will be the level to beat for Gold buyers.
On the flip side, the SMA100 four-hour around $1,943 will offer initial support, below which the previous week’ low at $1,940 could be probed.
The last line of defense for gold bulls is seen at the pivot point one-day S1 at $1,935.
Here is how it looks on the tool
About Technical Confluences Detector
The TCD (Technical Confluences Detector) is a tool to locate and point out those price levels where there is a congestion of indicators, moving averages, Fibonacci levels, Pivot Points, etc. If you are a short-term trader, you will find entry points for counter-trend strategies and hunt a few points at a time. If you are a medium-to-long-term trader, this tool will allow you to know in advance the price levels where a medium-to-long-term trend may stop and rest, where to unwind positions, or where to increase your position size.