- USD/CAD Price Analysis: Bulls take on bears at daily resistance
Market news
USD/CAD Price Analysis: Bulls take on bears at daily resistance
- USD/CAD is testing the ber's commitments at daily resistance.
- A 50% mean of the daily range near 1.2555 could act as first support.
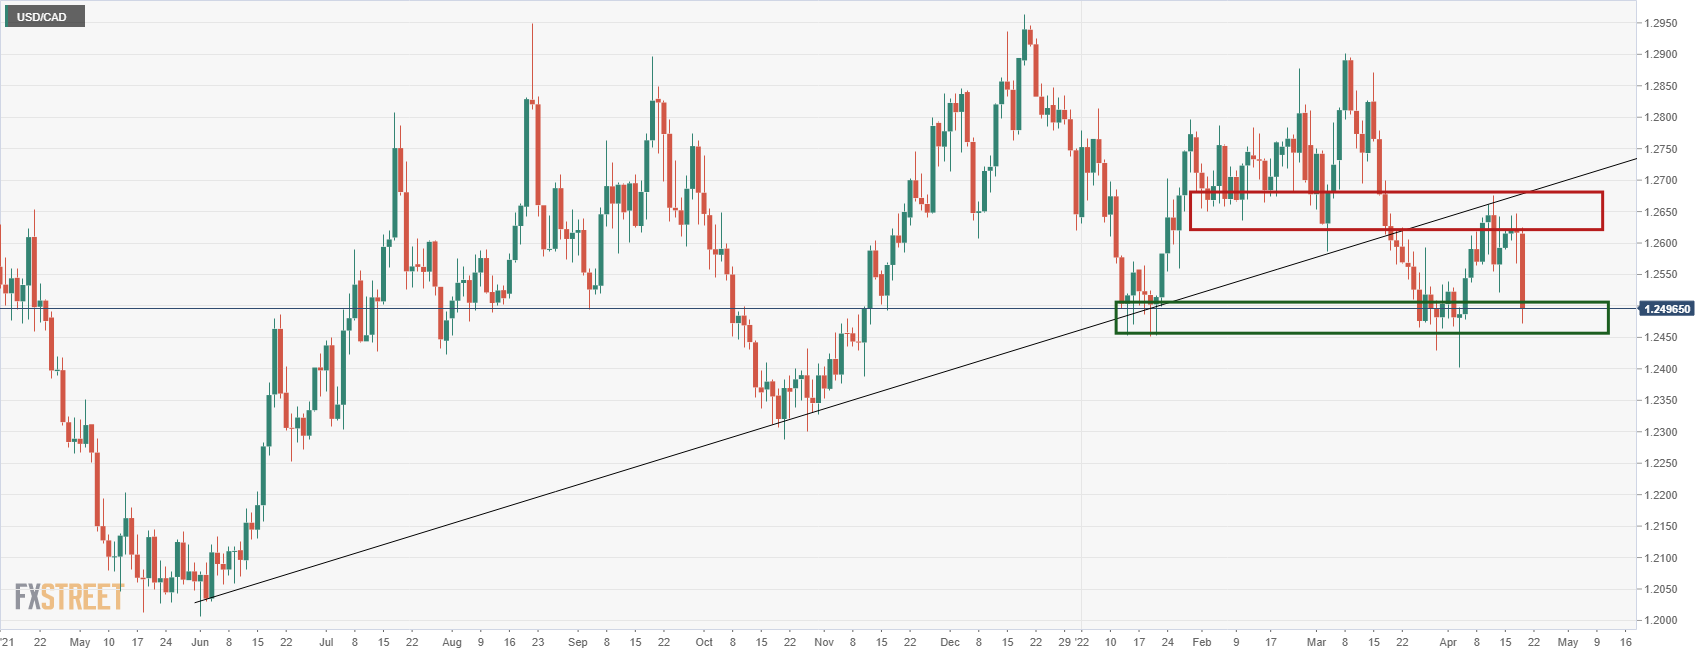
As per the prior analysis, USD/CAD Price Analysis: Bulls are stepping in and eye significant correction, the bulls took on the bears and rallied right back into the M-formation's neckline as illustrated in the following charts:
USD/CAD daily chart, prior analysis
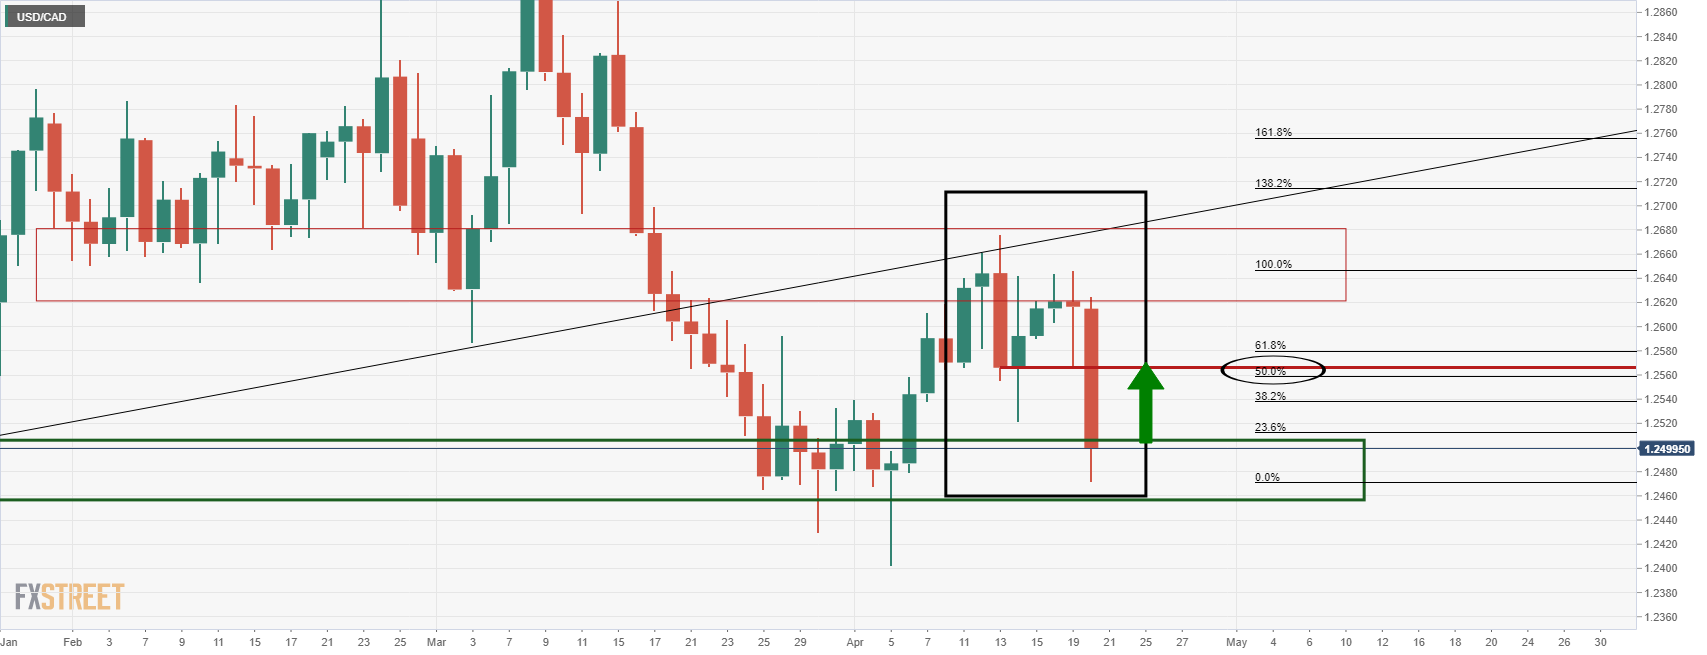
The M-formation is a reversion pattern so the price would now be expected to revert back to at least the neckline of the pattern:
USD/CAD, live market
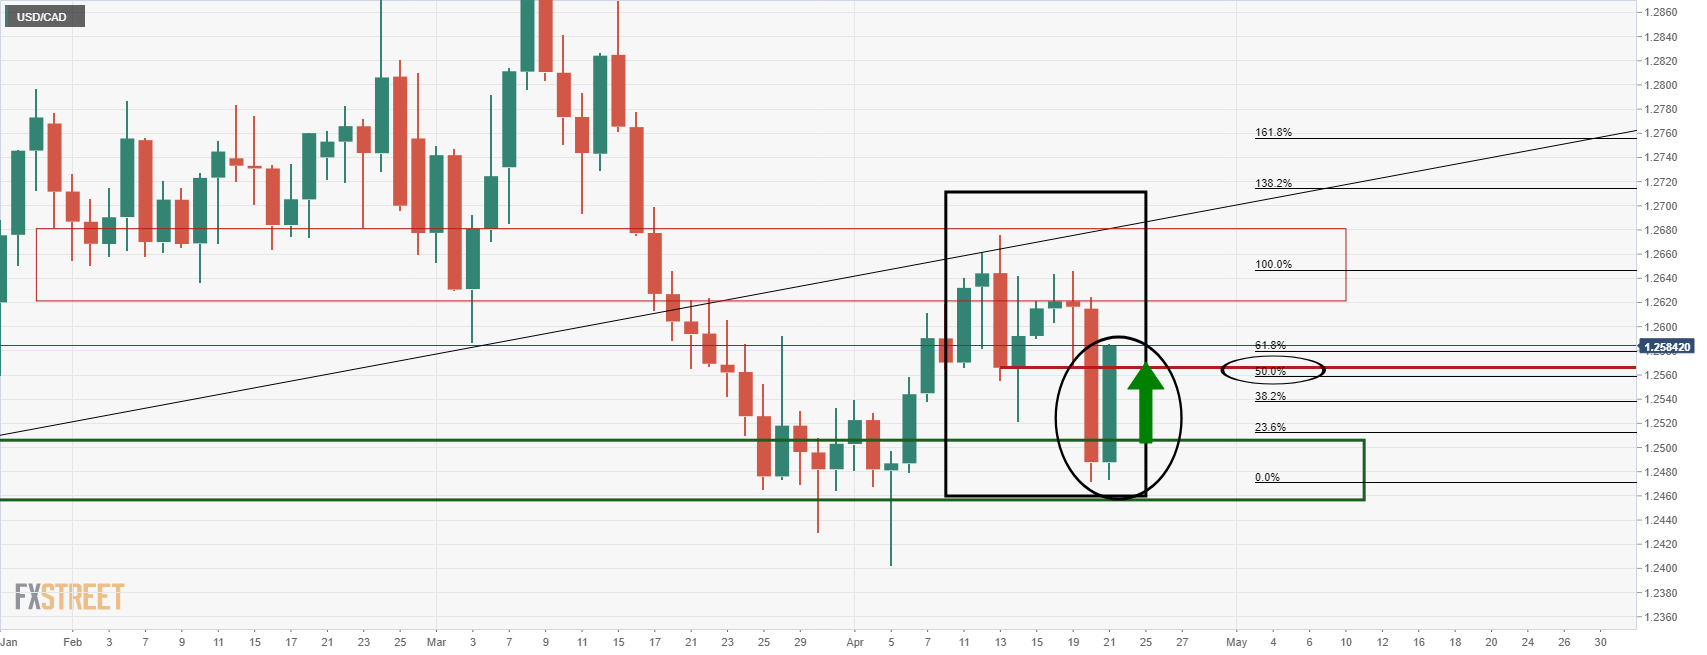
The price has moved in aggressively, as per the daily chart. However, there were opportunities on the lower time frames to take advantage of the move.
USD/CAD M15 chart
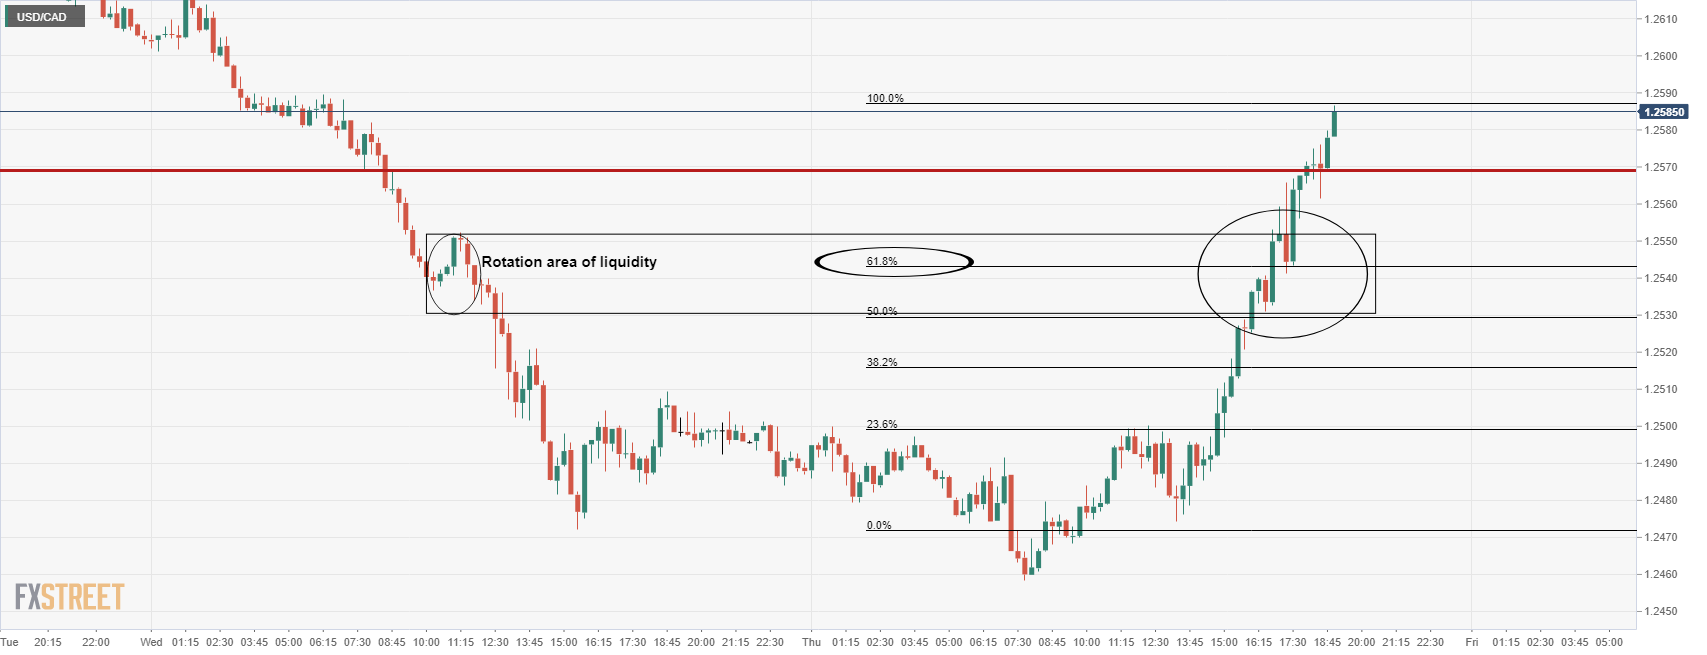
The area of rotation identified in the prior analysis from the hourly chart acted as an area of liquidity from which the 15-min and lower time frame chart traders would have likely engaged from within.
meanwhile, for the rest of the week, traders will be looking to see whether 1.26 the figure will deny the bulls of further upside at this juncture which would leave the price trapped between daily support and resistance:
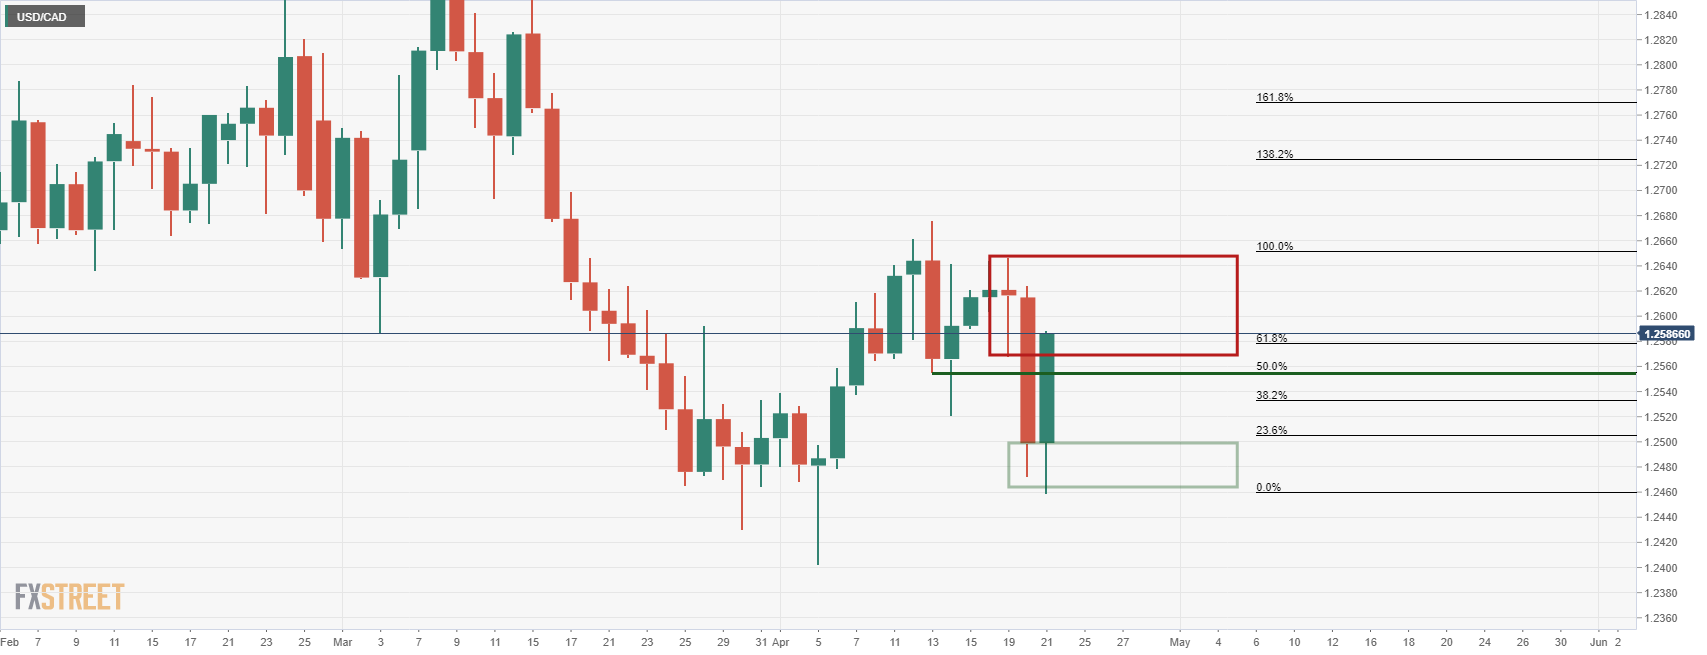
The daily chart's 50% mean reversion of the recent range could be the first area of support that may hold initial tests around 1.2555.