- US 10-year Yield Price Analysis: Upward pressured but struggling at the 3.00% threshold
Market news
US 10-year Yield Price Analysis: Upward pressured but struggling at the 3.00% threshold
- The US 10-year Treasury yield has jumped since April 27, 30-bps.
- Expectations of a 50-bps rate hike by the Fed keep US Treasury yields upward pressured.
On Tuesday, the US 10-year Treasury yield registered losses of one basis point and finished around 2.979% amidst a choppy trading session ahead of the Federal Reserve May meeting.
The 10-year benchmark note began Tuesday’s session around 2.990% and reached a daily high at around 3.010%, but retreated from the YTD highs and settled around 2.979%.
Wednesday’s Federal Reserve monetary policy decision had kept US Treasury yields in the driver’s seat since April 27, as investors expect at least a 50-bps rate hike by the Fed, alongside the beginning of the reduction of the $8.9 trillion balance sheet.
Also read: Gold Price Forecast: XAU/USD bears reclaimed the 100-DMA and targets the 200-DMA at around $1835
US 10-year Treasury Yield Forecast: Technical outlook
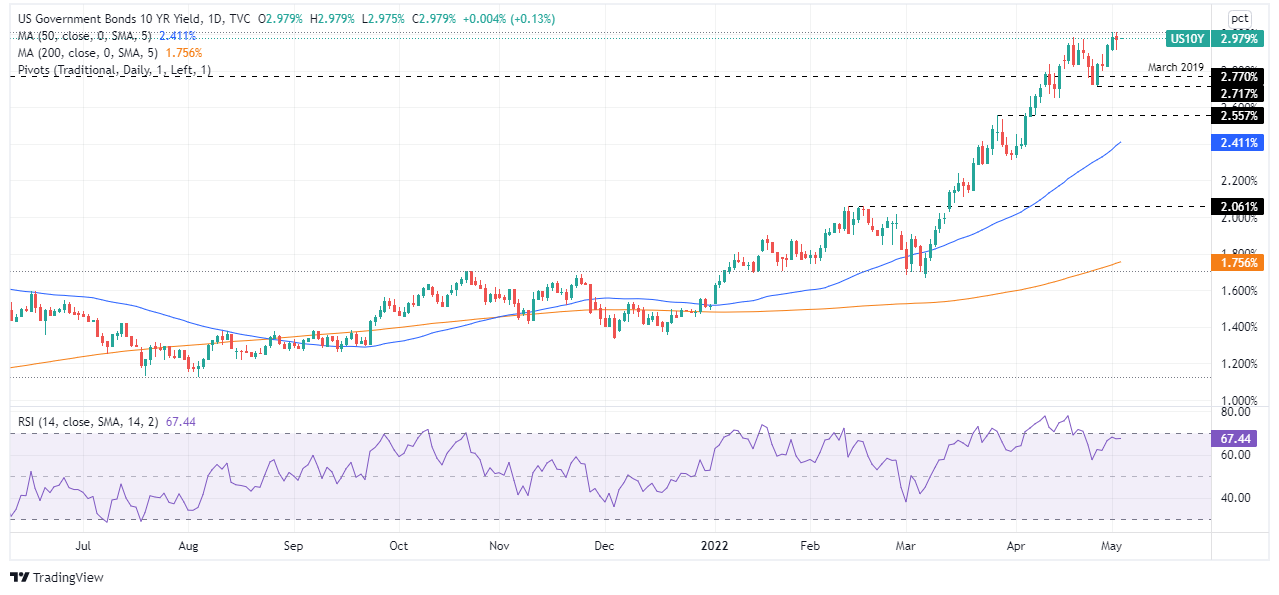
From a technical analysis perspective, the 10-year benchmark note is upward biased. However, it faces solid resistance around the 3% threshold, a level not reached since December 2018. The Relative Strength Index (RSI) at 67.44 aims lower, contrary to the 10-year graph, which means that negative divergence between the yield/oscillators could drag yields lower.
With that said, on the downside, the US 10-year T-note yield first support would be the 2.80% threshold. A break below would expose March’s 2019 2.77% high, followed by April 27 lows at 2.717%. In the event of yields plunging lower, the next stop would be March’s 28 highs at around 2.557%.
To the upside, the US 10-year T-note yield first resistance would be 3.00%. A breach of the latter would expose November 7, 2018, highs at around 3.252%.